TransAuditor Product Design
Reimagining the intersection of efficient transportation management + education
Role: Lead Product Designer
Collaborators: Product Manager, Front-end Developer, Back-end Developer, Jr. Designer
Timeline: Four months (fractional)
OVERVIEW
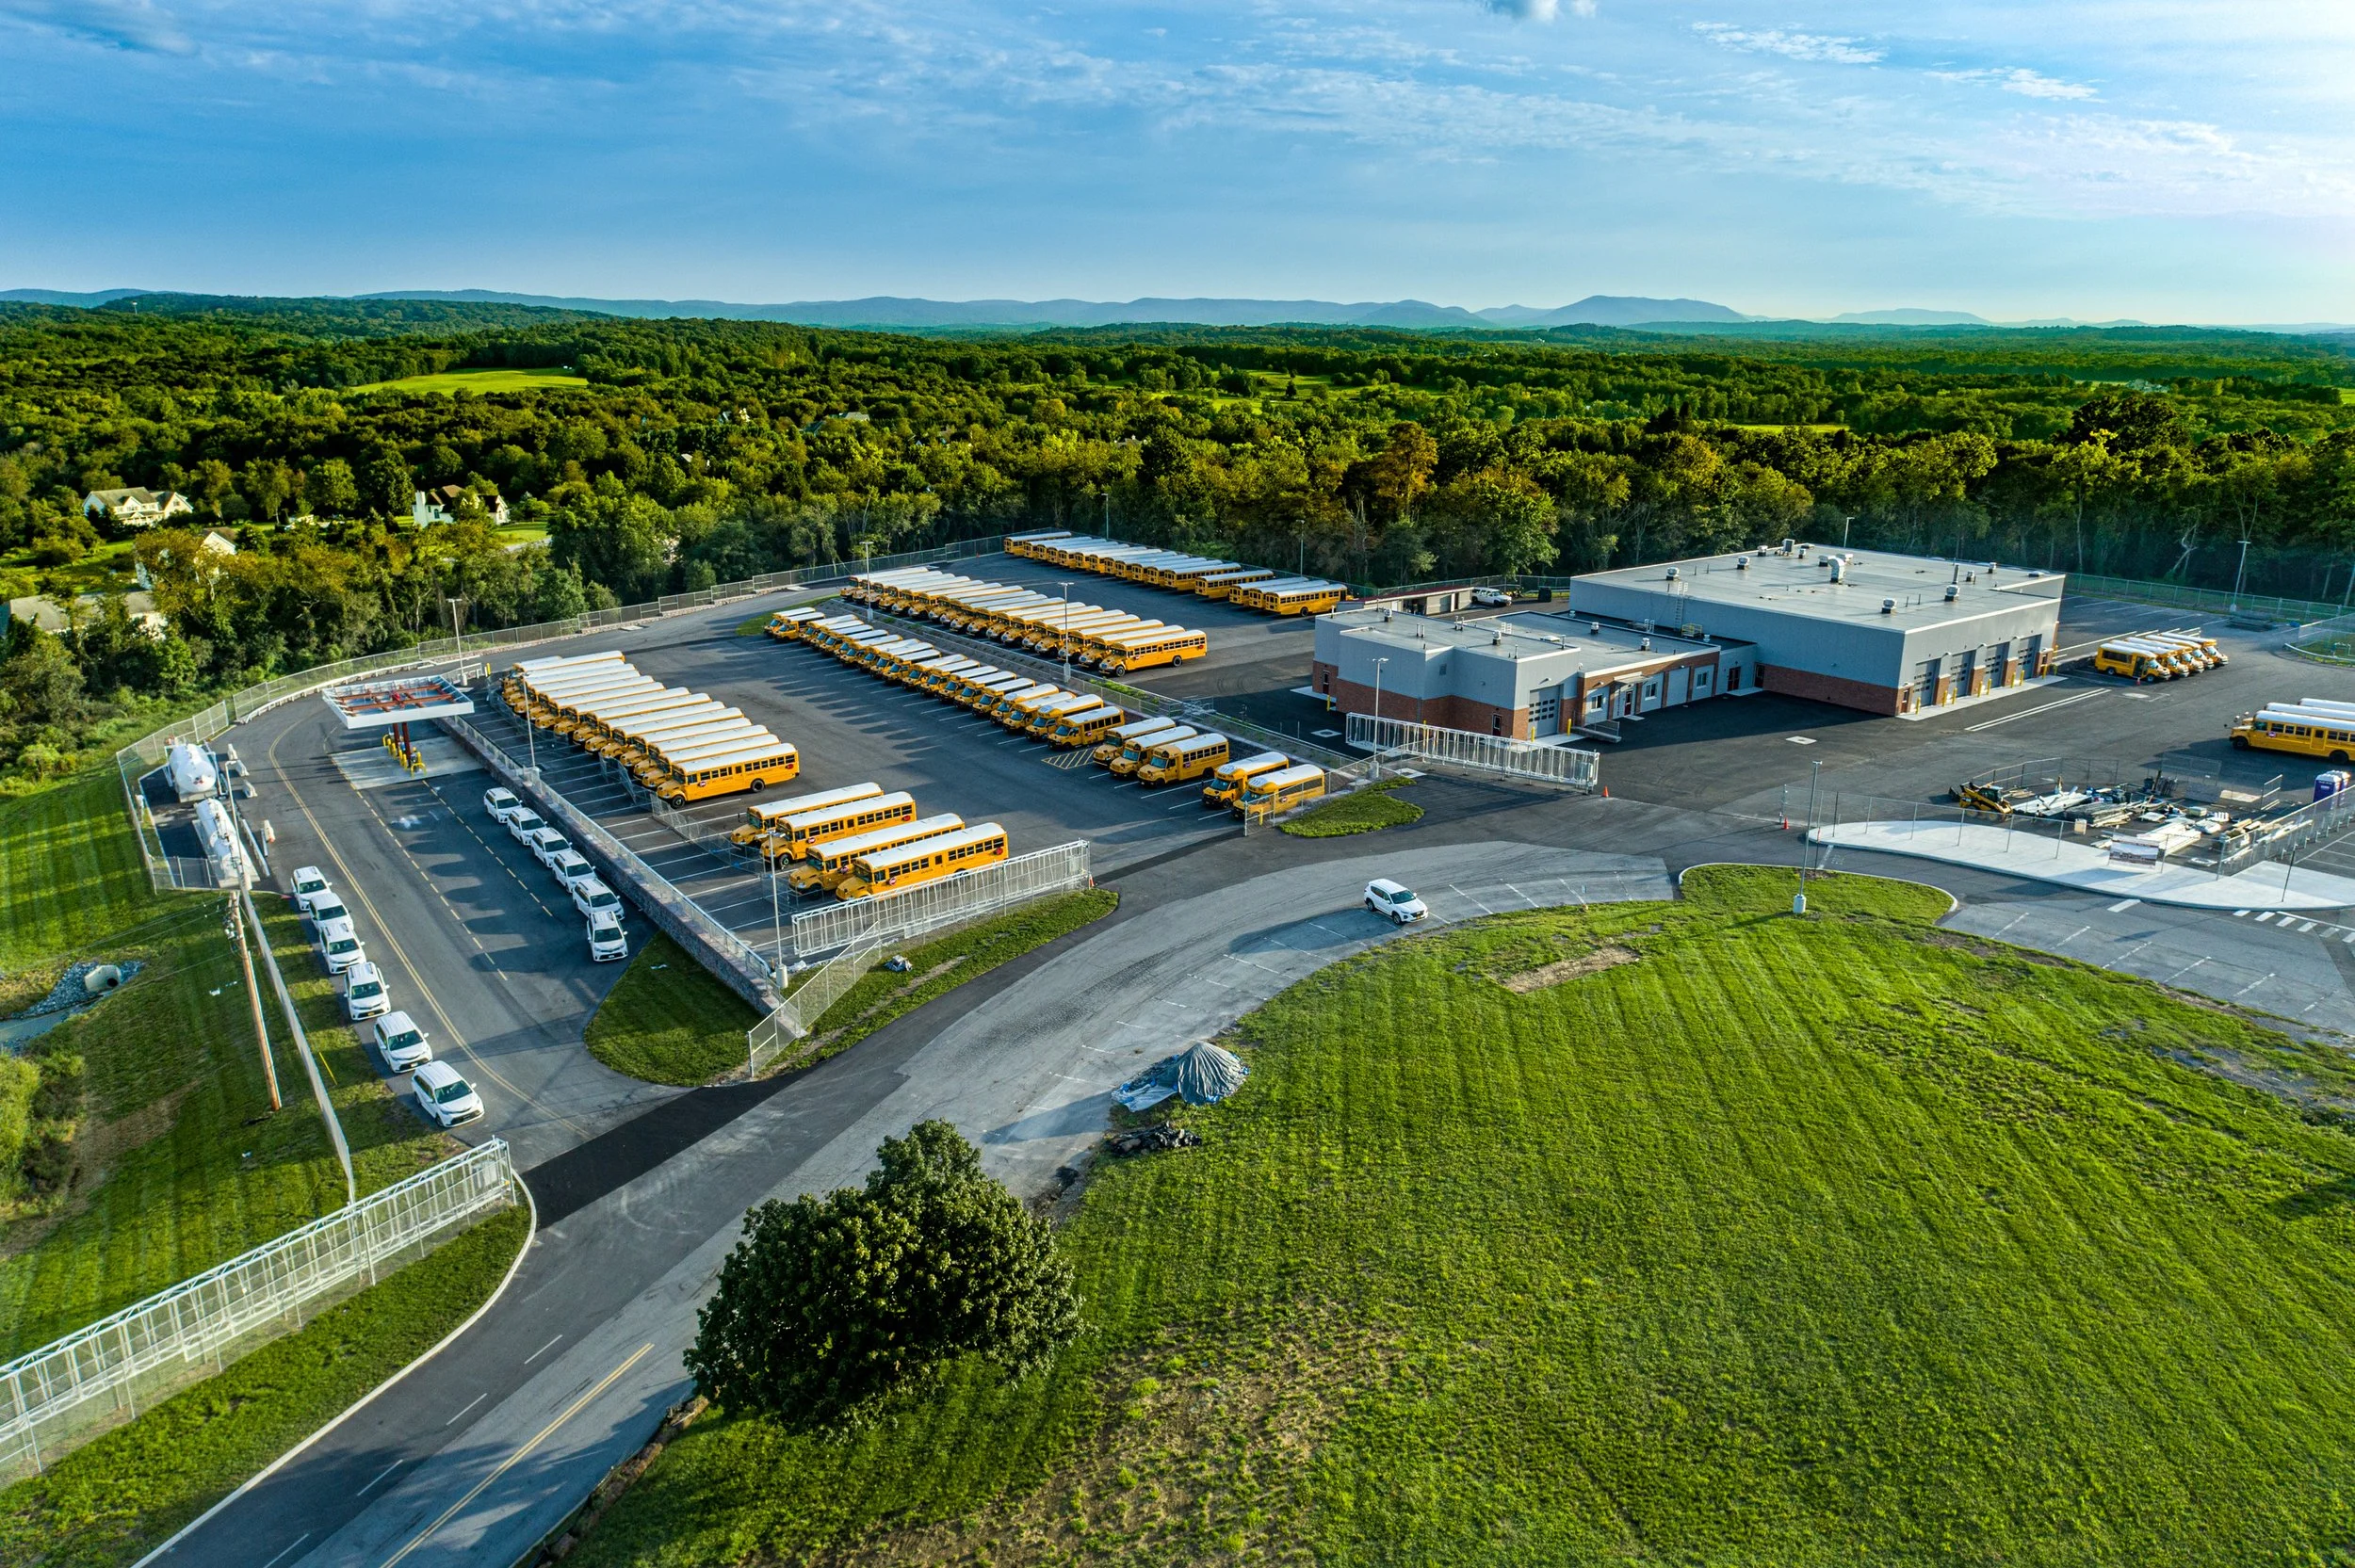
The Problem: School transportation is a complex challenge involving contractors, special needs planning, and strict legal and budget constraints. While many districts collect GPS data, they lack tools to translate it into clear insights that drive meaningful improvements.
The Goal: TransAuditor, a new Geo Data Intelligence (GDI) product, introduces “planned vs. actual” KPI metrics to help districts simplify data and optimize operations, improving outcomes for students and districts alike.
Business Objectives: No comparable product exists in the industry, creating a large and eager market with a strong opportunity to scale the business. Compared to GDI’s past products, TransAuditor is as a low-touch support solution that improves internal business operations and will increase profitability.
Complexities in School Transportation Planning:


USER RESEARCH
User Research: We conducted in-person interviews and email surveys with Transportation Directors, Routing Analysts, and fleet management staff across both large urban and smaller suburban districts. These conversations gave us a nuanced view of daily workflows, pain points, and long-term challenges. Our understanding was further grounded by the expertise of our Product Manager, who spent five years as a Routing Analyst in the Philadelphia School District, bringing firsthand experience of the complexities our users face.
Key Stakeholders: From this research, we identified three core user roles in school transportation: the Transportation Director, accountable for strategy, emergencies, and board reporting; the Routing Analyst, focused on efficiency and safety in daily operations; and the Finance Specialist, responsible for fiscal oversight and audit-ready accuracy. These roles clarified the distinct goals, challenges, and decision-making needs that shaped our design approach.
Transportation Director
Oversees routing, finance, contractors, dispatch, and communications. Balances strategy with emergencies, needing reliable data to ensure safety, efficiency, and accountability across the district.
-
Ensure operational reliability: safe, efficient, on-time transportation for all students.
Oversee budgeting, resource allocation, and long-term planning (fleet age, fuel usage, bell times).
Provide transparent reporting to district leadership.
-
Constant pressure on On-Time Arrival %, a highly visible KPI.
Balancing resources: vehicle assignments, monitors, drivers, and student needs.
Political/fiscal scrutiny: budget fluctuations, lawsuits, and community concerns.
-
Monitors dashboards weekly for on-time arrival and operational health.
Reviews quarterly/annual reports on budgeting, fleet age, and fuel usage.
Delegates tasks to routing, finance, and garage teams but needs top-level summaries for fast decisions.

Routing Analyst
Manages daily routing for thousands of students. Balances safety, efficiency, and compliance while adjusting stops and trips. Needs clear data to make confident, timely decisions.
-
Ensure student safety (stops are safe, ride times appropriate, correct vehicles & equipment).
Maintain operational efficiency (capacity management, stop consolidation, on-time arrival, tiering runs).
Provide equitable service, including IEP accommodations and curb-to-curb requests.
-
Manual workload: Constantly adding, moving, consolidating, or removing stops.
Daily issues: Handling special requests, last-minute changes, non-emergency disruptions.
Complex constraints: Restricted ride-times, limited drivers/vehicles, specialized equipment needs.
-
Reviews routes daily for timeliness and efficiency.
Runs in-depth analysis on route segments, depot/school attributes, slack time.
Manages quarterly/annual restructuring as student populations and resources shift.
Relies on software outputs + manual judgment — wants dashboards that clearly show impact of changes.

Accounting Specialist
Oversees budgets and vendor invoices, ensuring fiscal accuracy and compliance. Works with routing staff and contractors, needing audit-ready data to catch discrepancies and maintain transparency.
-
Maintain accurate budget projections to support district planning.
Compare planned vs. actual services to detect billing discrepancies.
Support fiscal responsibility and compliance for audits and board reporting.
-
Manual reconciliation: Without automation, tasks become error-prone and slow.
Accountability pressure: Must defend budgets and payments to district leadership and external auditors.
-
Regularly pulls data from TransAuditor for invoice analysis (e.g., TA-29 Bus Contractor Invoicing).
Compares contractor charges against routing plan data for validation.
Needs clear, auditable records that link financial transactions to operational data (stops, trips, routes).
IDEATION + AI
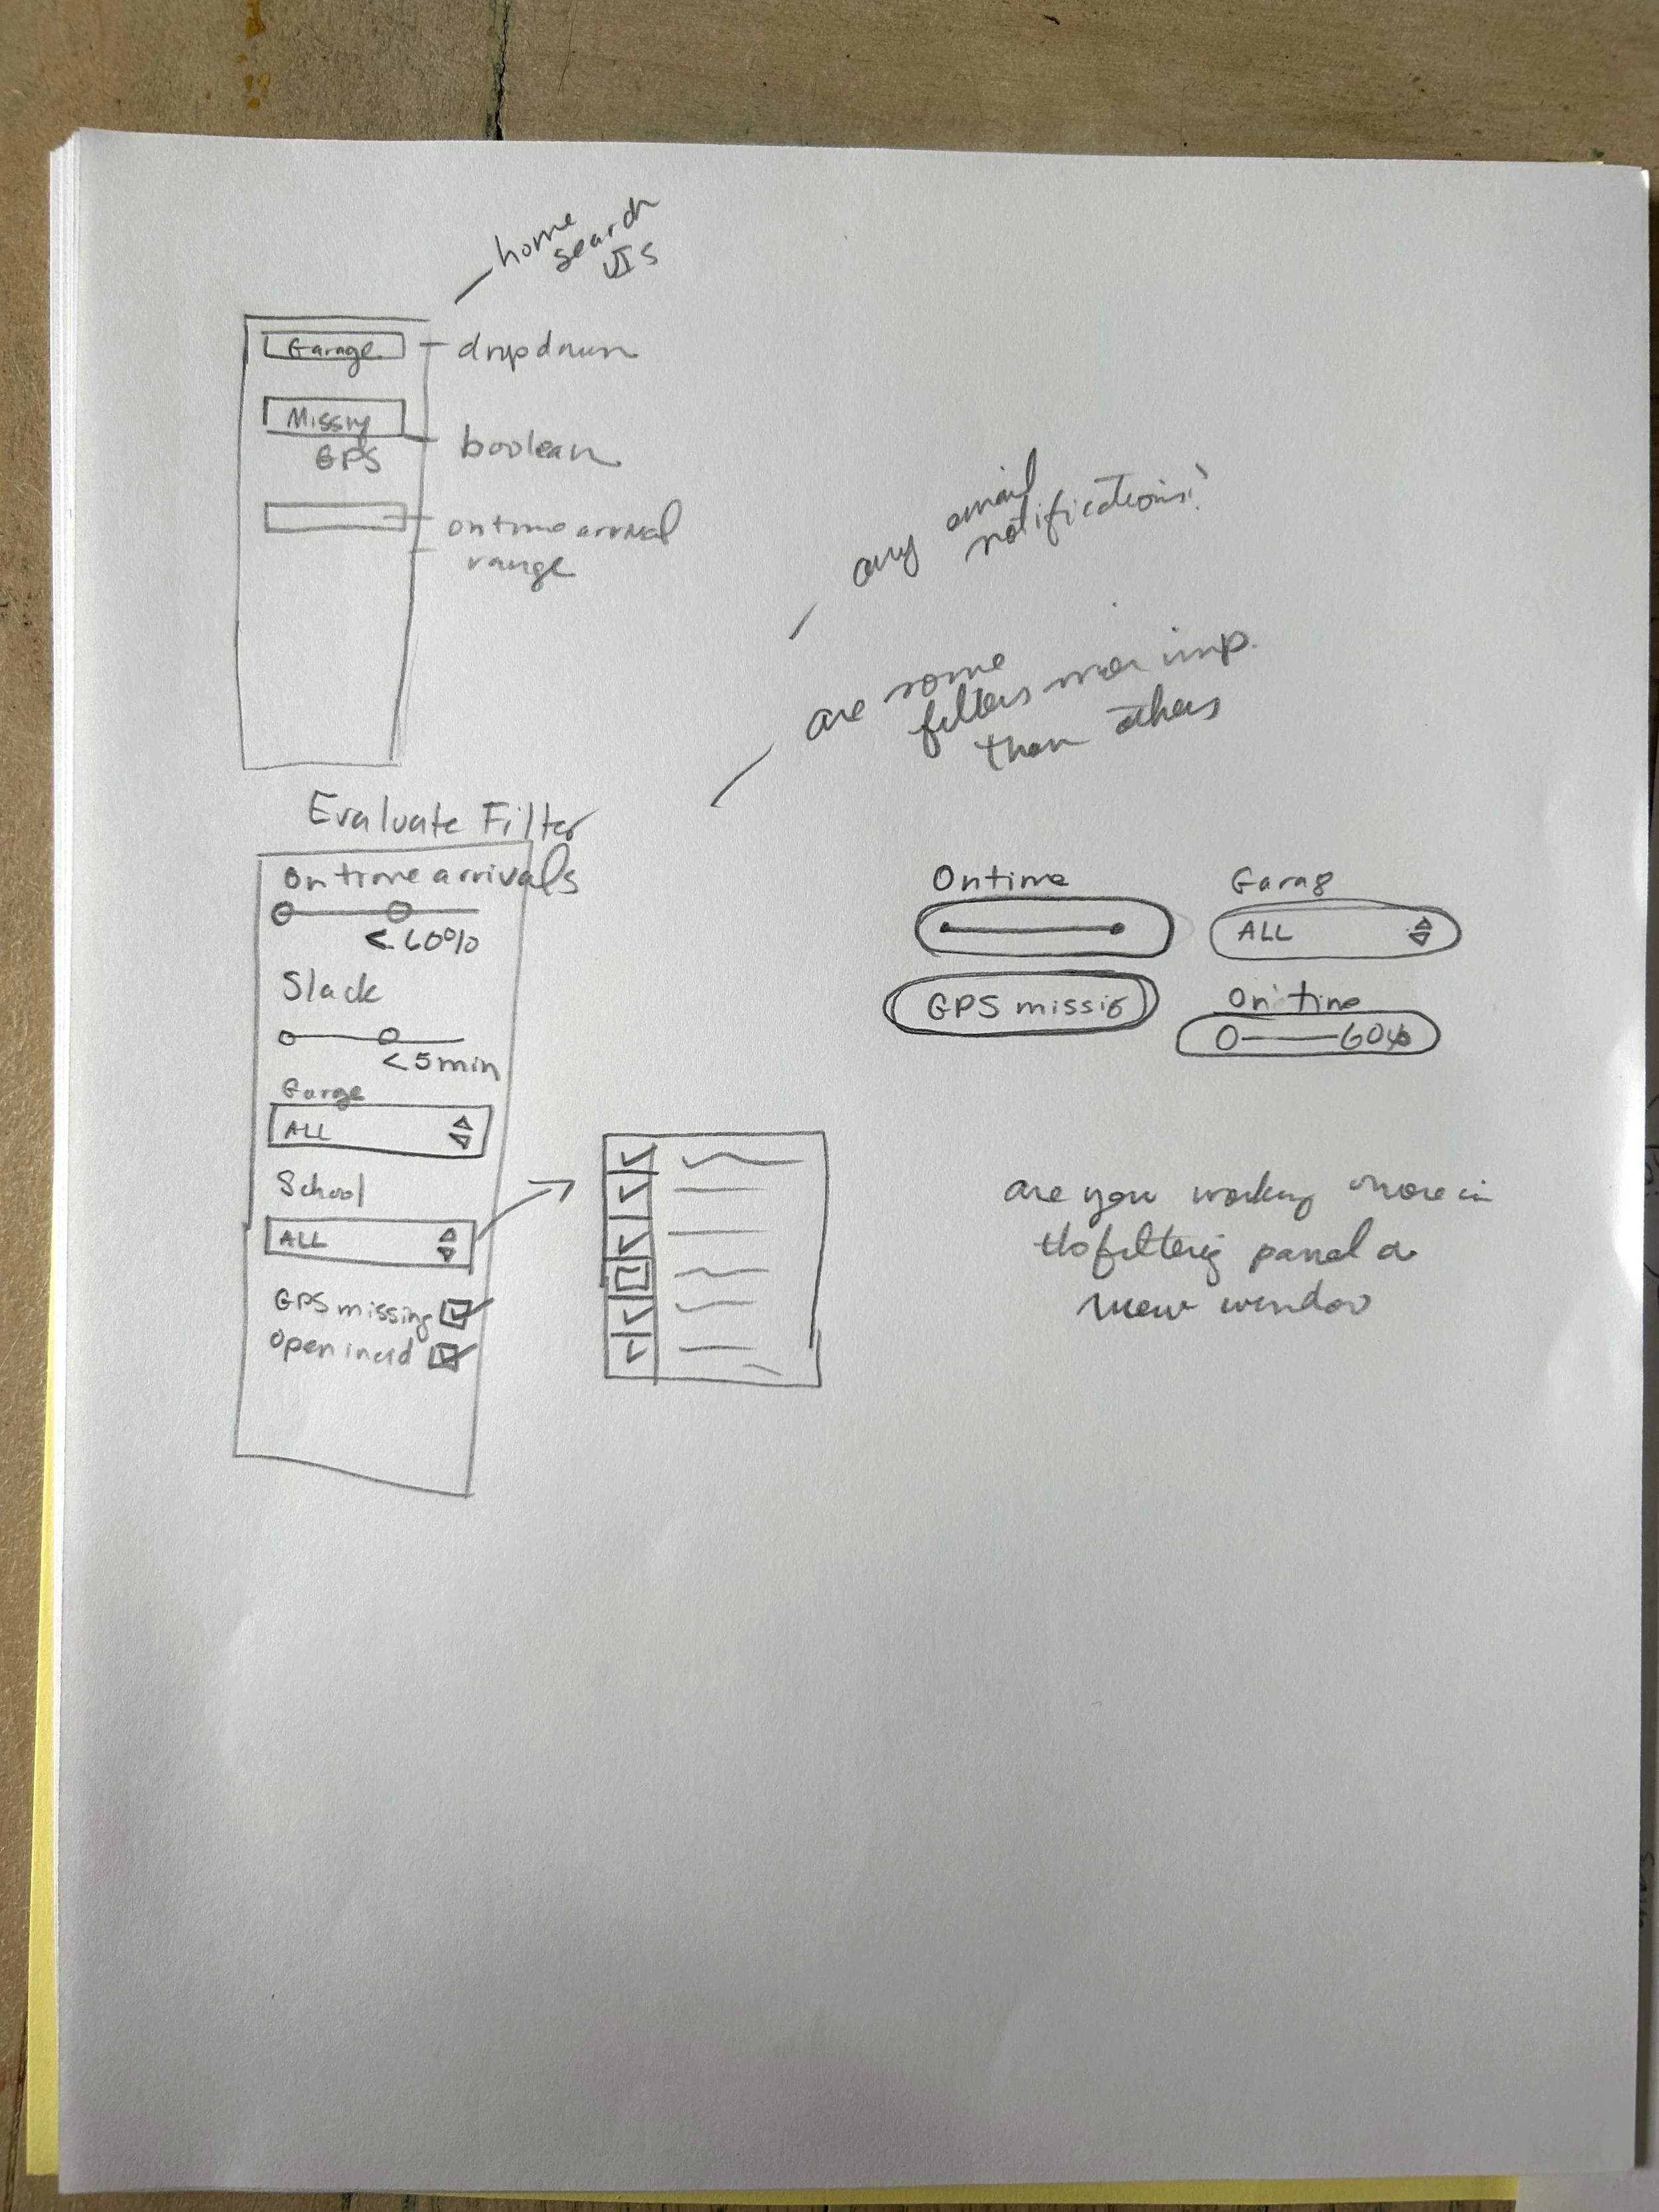
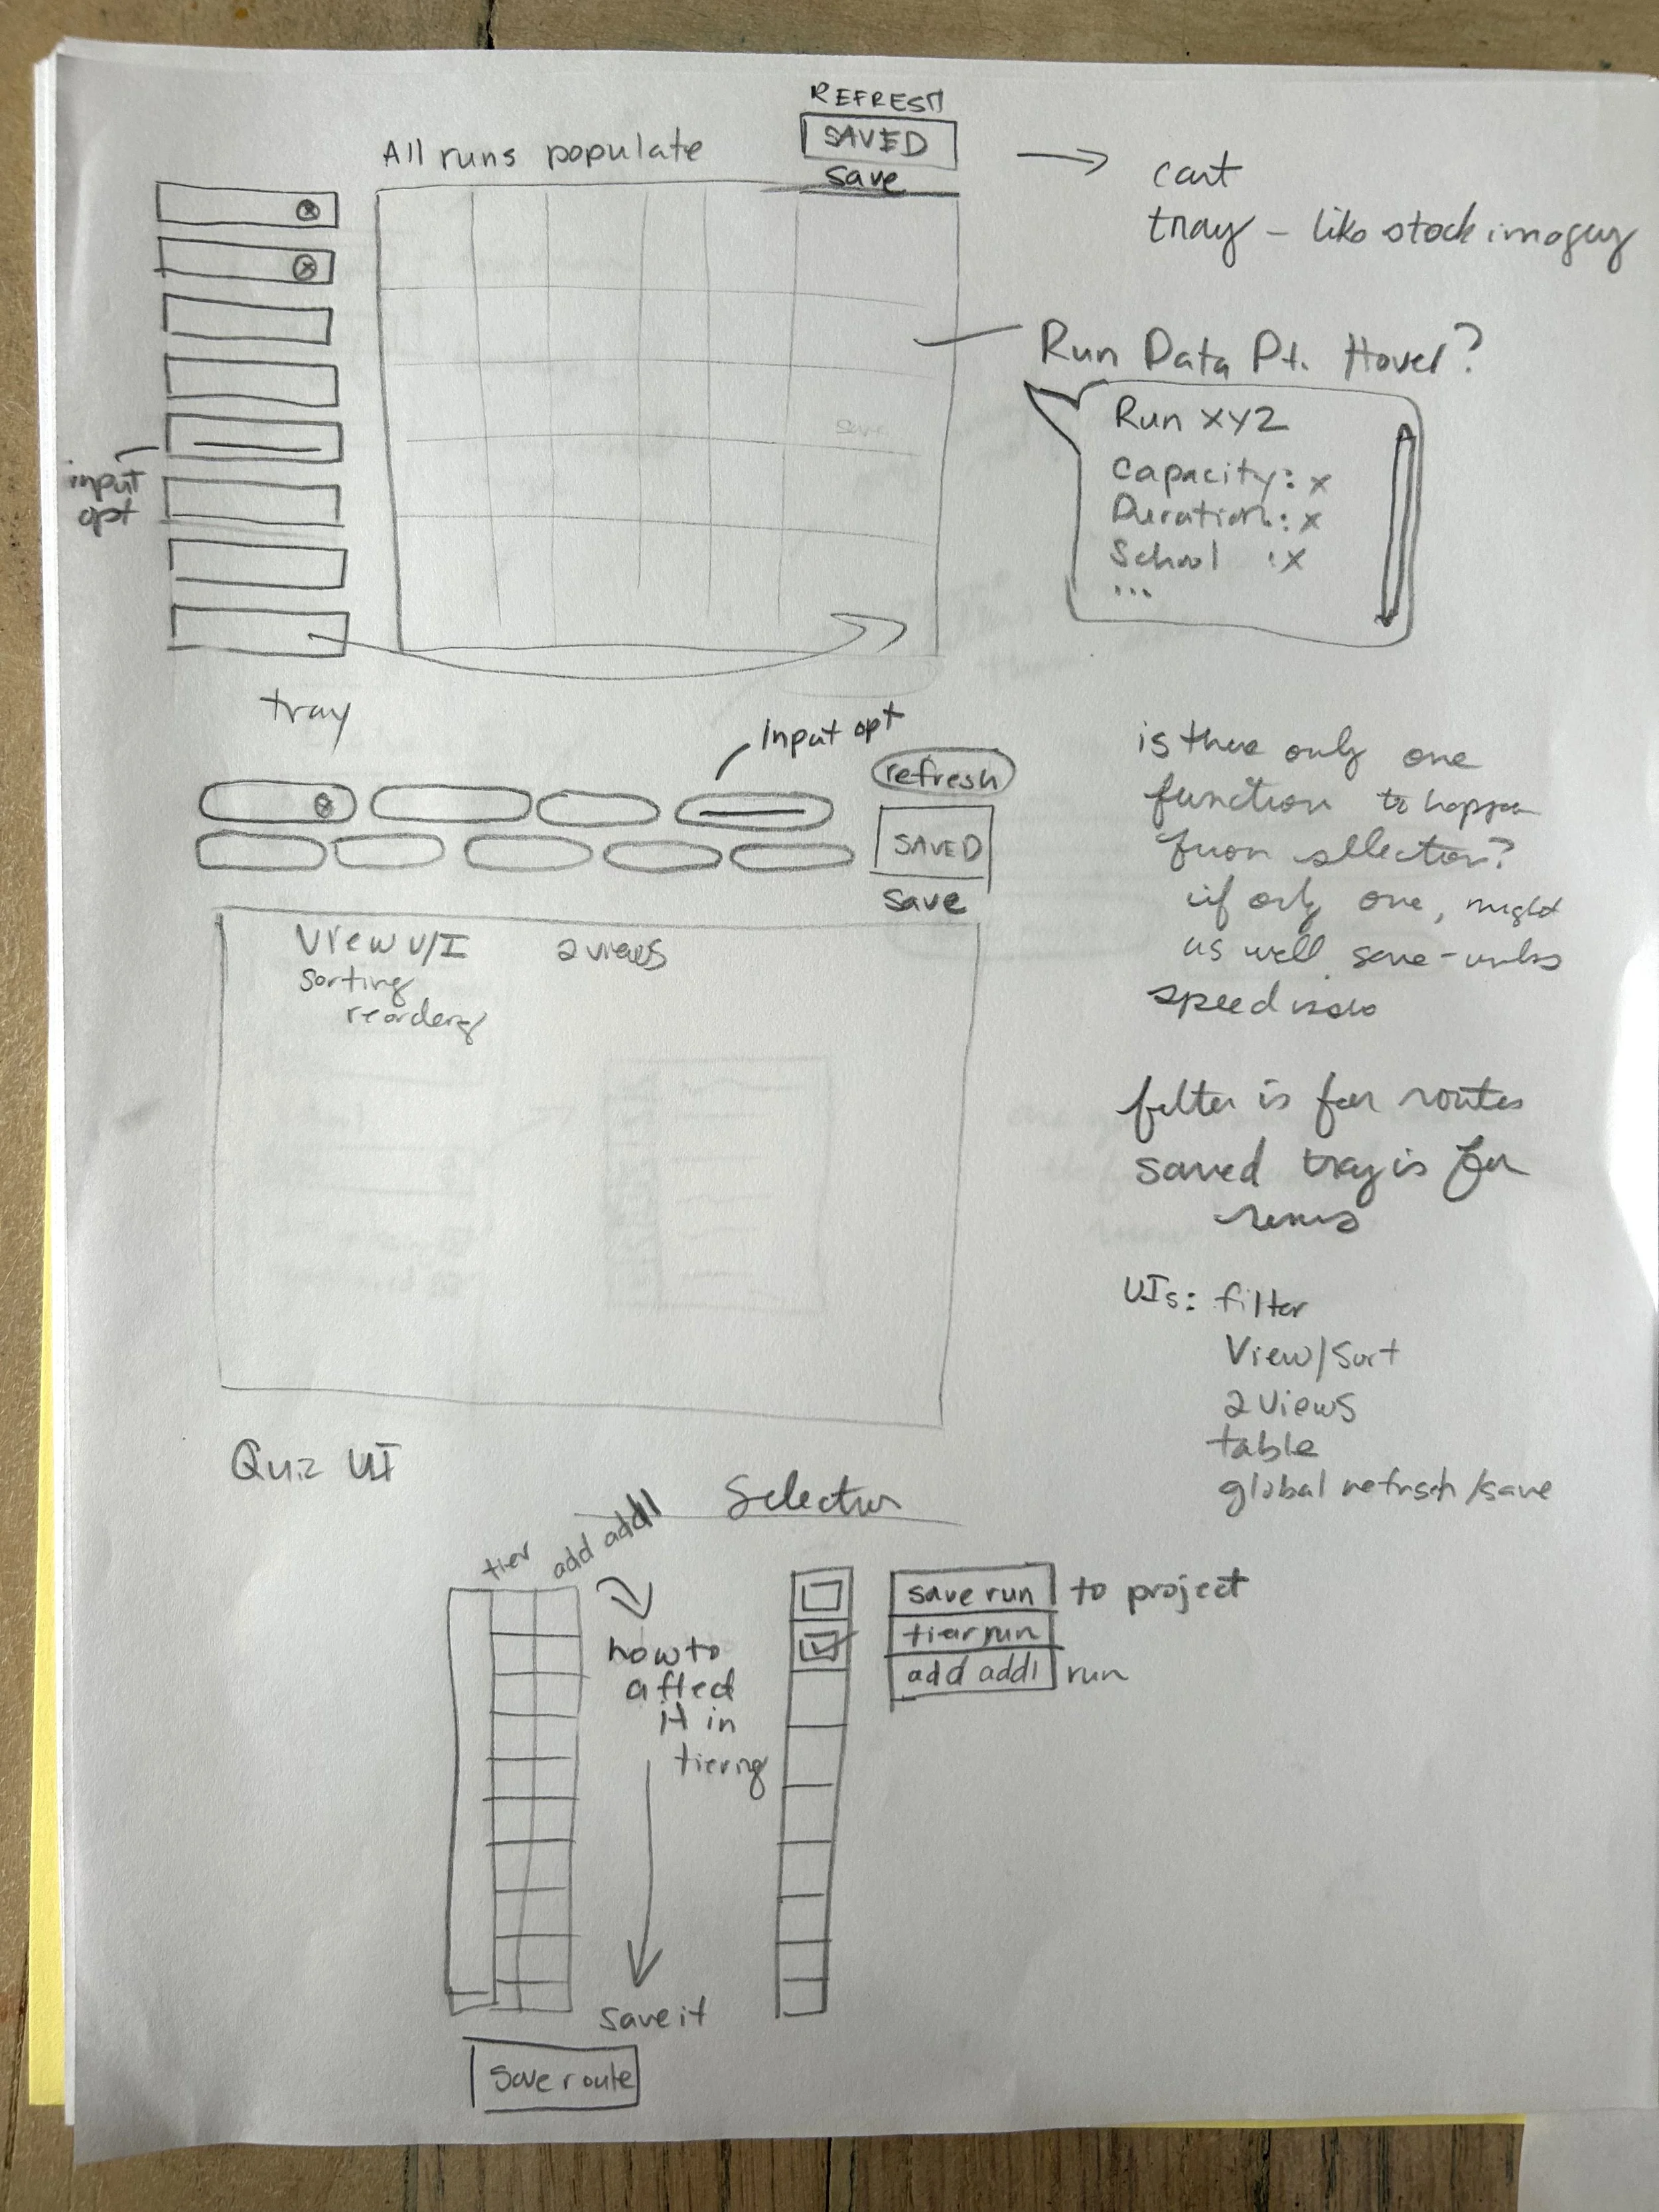
Flows: With the tabulated survey data, persona needs, and the Product Manager’s general direction I sketched a user journey flow for the TransAuditor product that includes 5 separate, yet integrated modules: Dashboard, Planned Vs. Actual KPIs, Route Tiering Analysis, Route Re-Tiering Process, and Incident Tracker. The 3 modules that I have focused on answering “How might we?” are the Dashboard, Tiering Analysis and Tiering Process. I began my ideation process with hand sketches to see what approaches might best solve for the issues at hand.
AI: With Lovable.dev, I crafted prompts based off of our research data, user personas, product requirements, and my initial user experience ideas to generate solutions. The first drafts were always interesting yet imperfect, so I continued to iterate in Lovable to refine the experience. I used Lovable as a sort of playground to strategically tinker with ideas and mine smart elements for wireframing.


WIREFRAMING + ITERATION
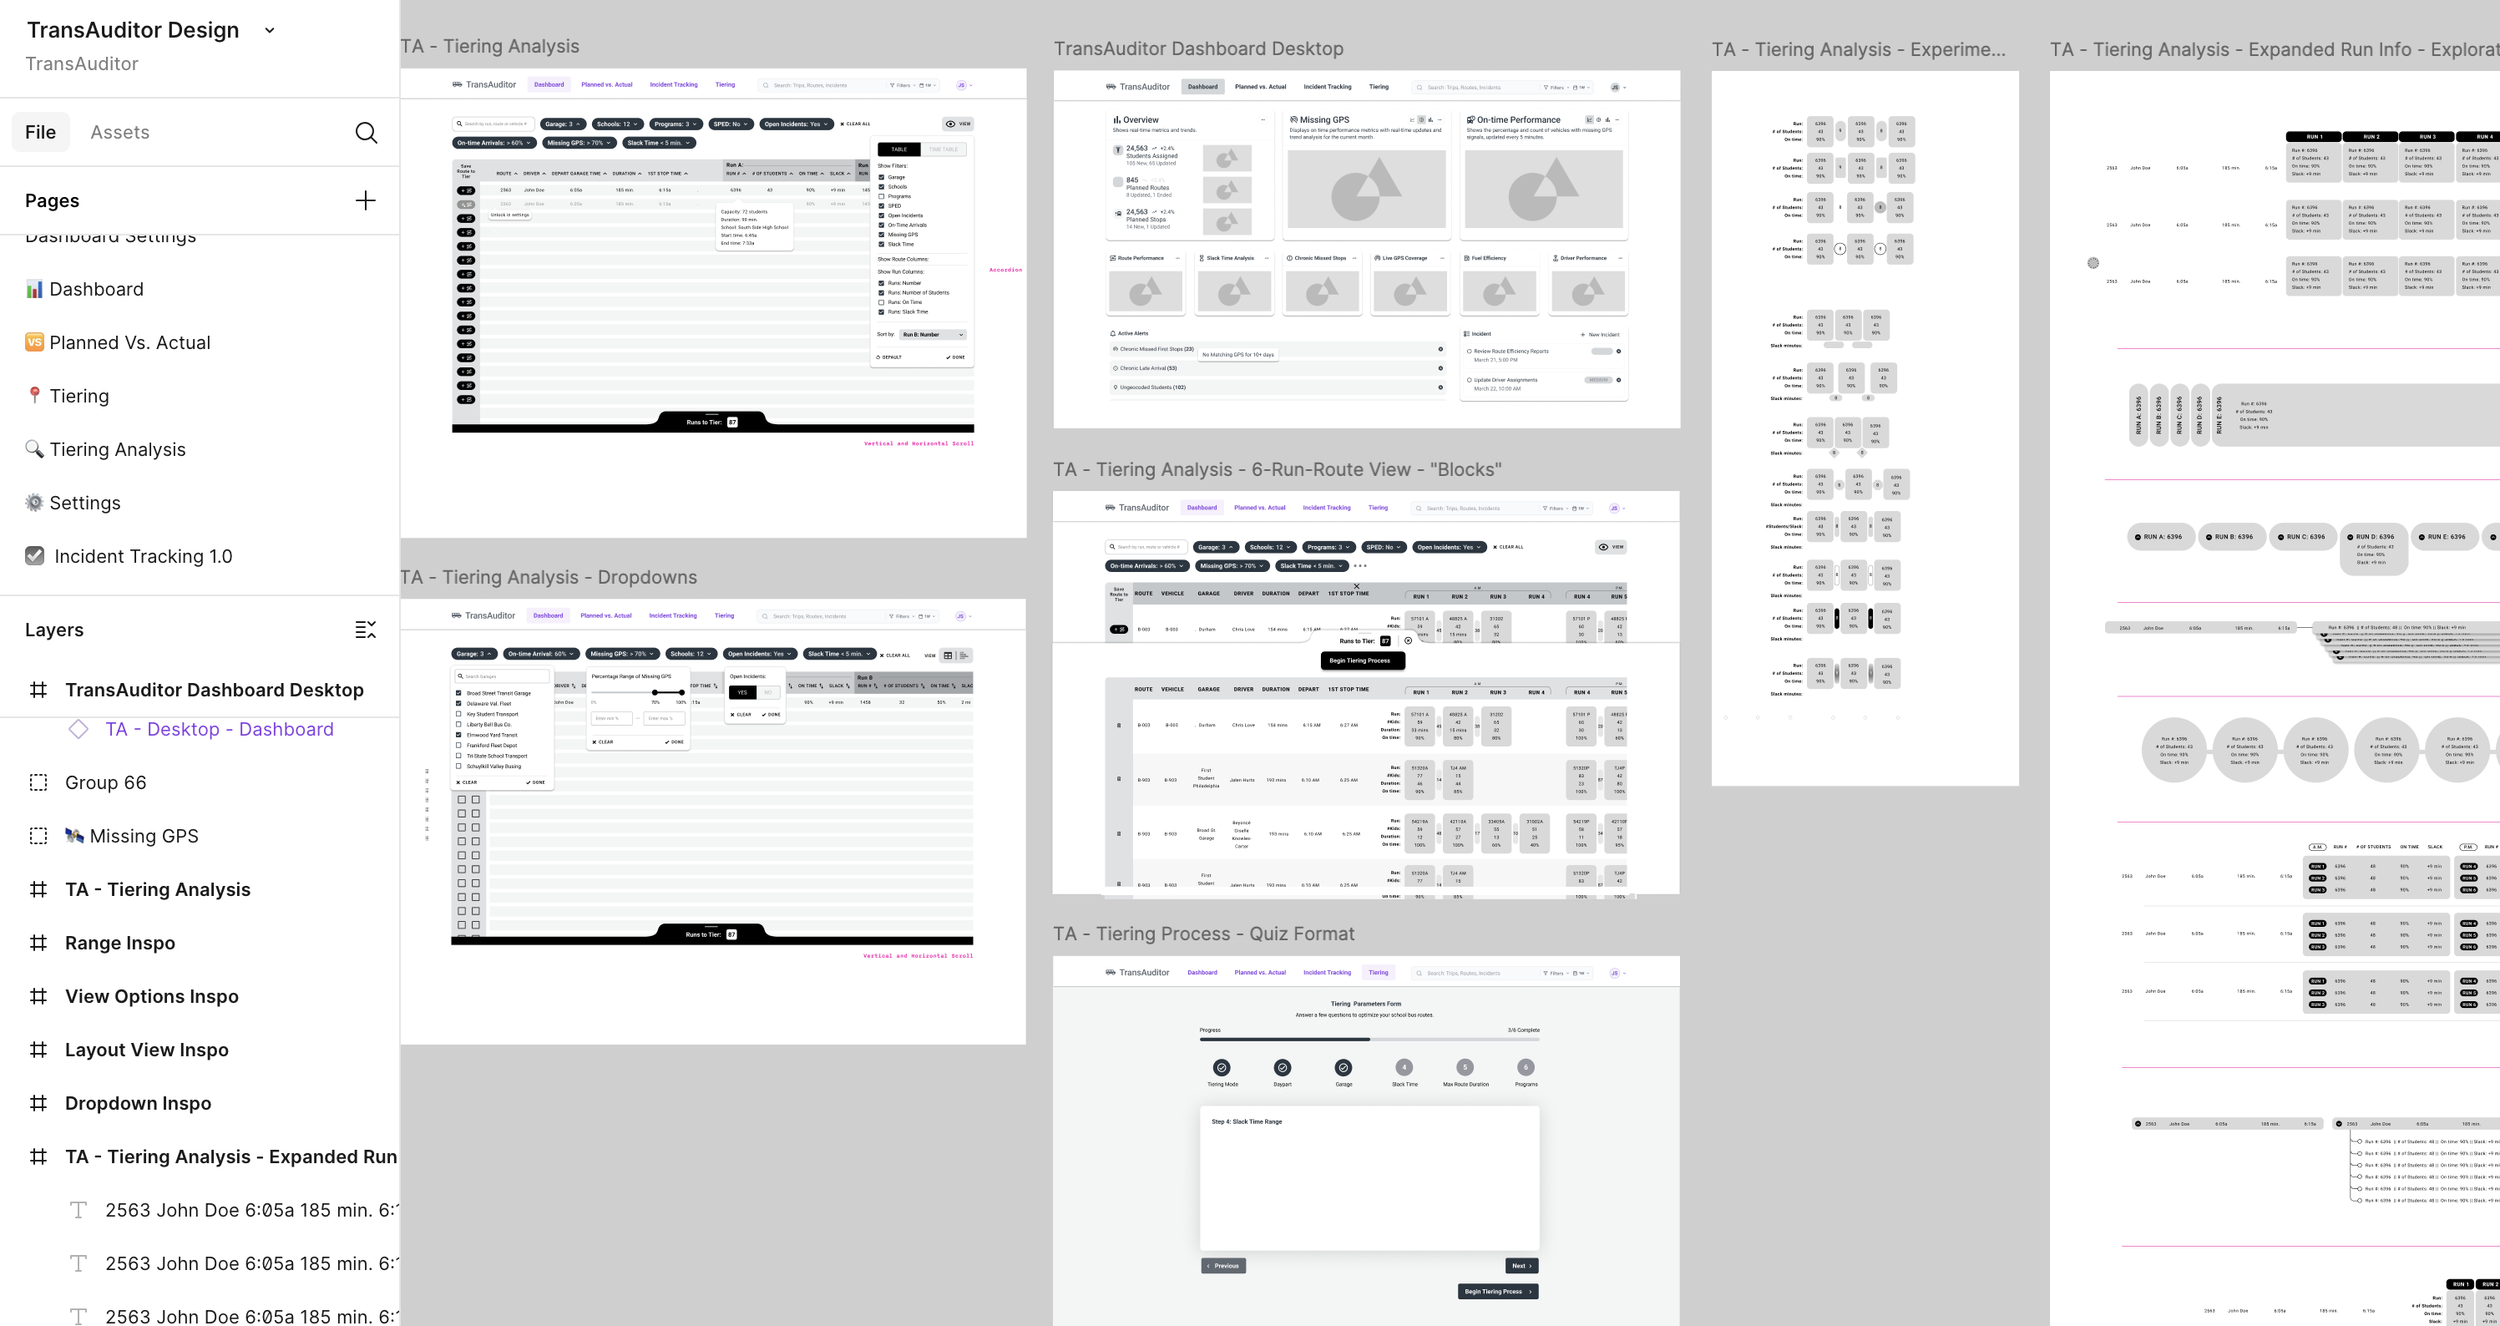
Wireframing: In our survey, 99% of Routing Analysts reported using desktops for route tiering; based on this, and input from our Product Manager, I prioritized wireframing the desktop experience first. After researching a variety of non-industry product solutions, sketching, and iterating with AI, I began to craft digital wireframes within Figma for a core group of school transportation aficionados to view and provide feedback.
Feedback + Iteration: Our team meets weekly with a core group of school transportation consultants who were formerly in various roles within school transportation departments. They were very encouraged by the potential impact of the tool and offered valuable insights into what features would be helpful to Route Analysts, what information might need to be displayed rather than nested, and what KPIs different users might want to see most frequently. I implemented those helpful suggestions into the wireframes as I started to move them from initial designs into high-fidelity layouts. For example, the group unanimously said that being able to filter routes by school was imperative. So, I added that filter to the design.
DESIGN SYSTEM
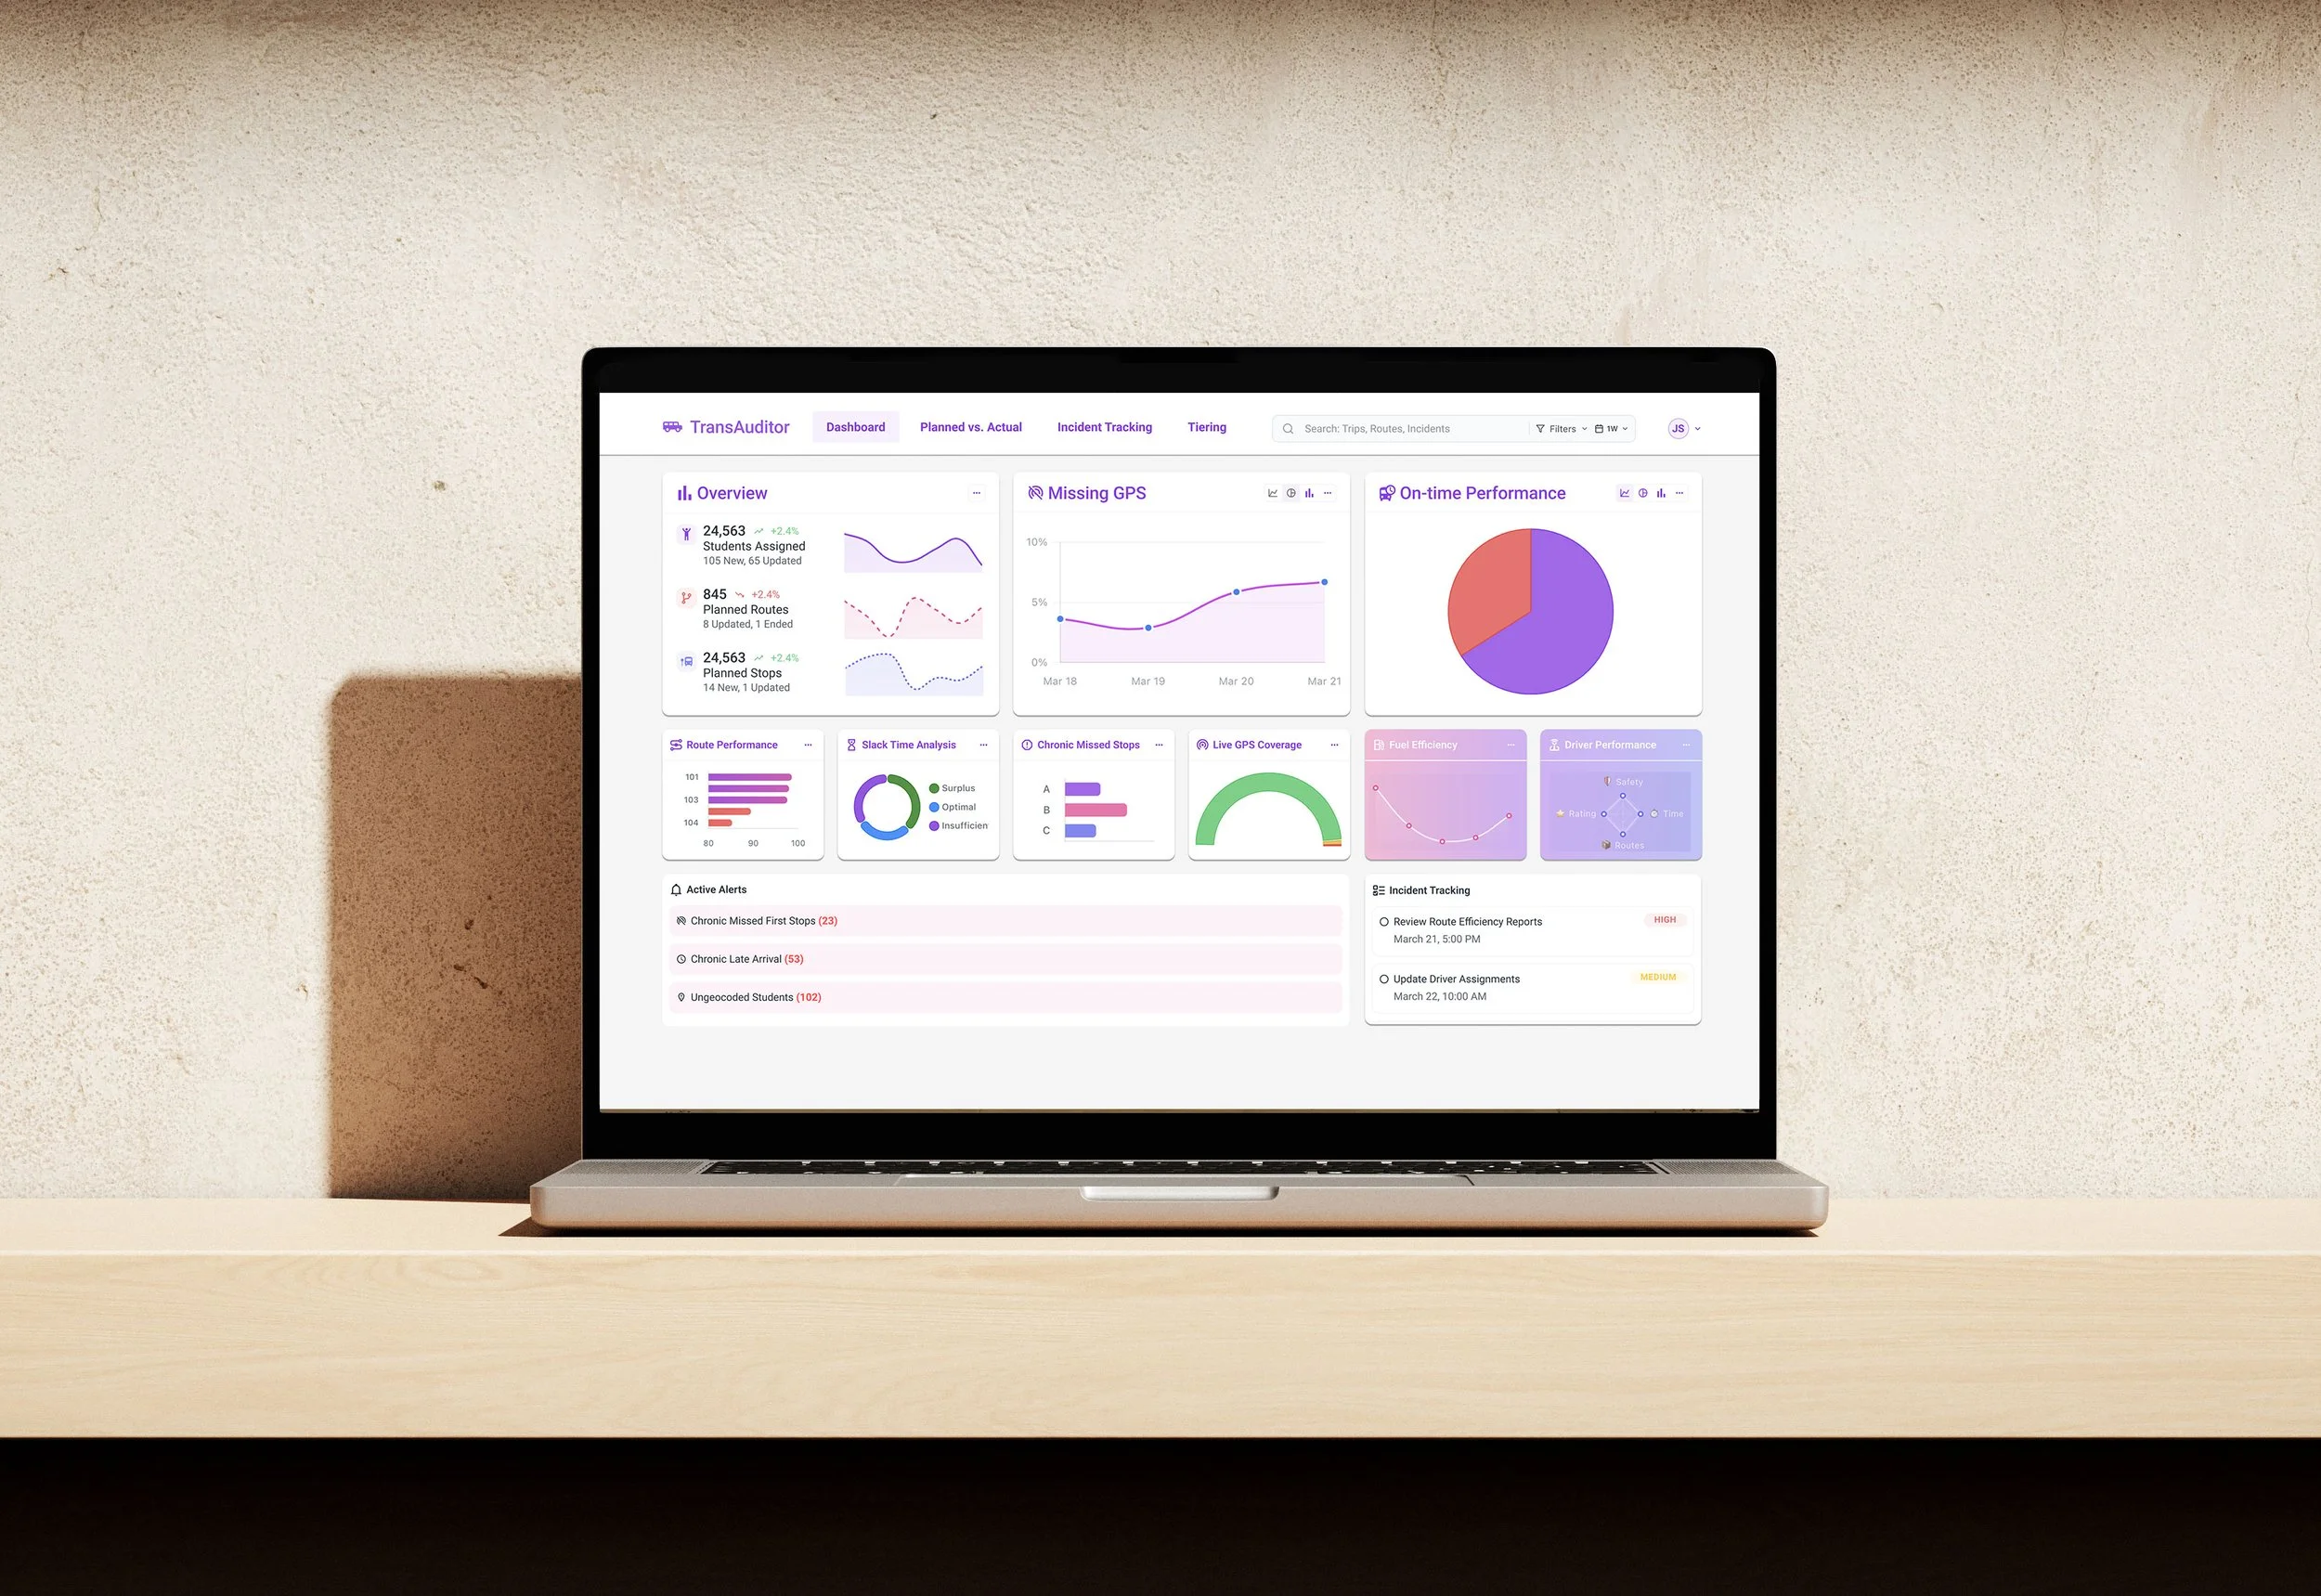
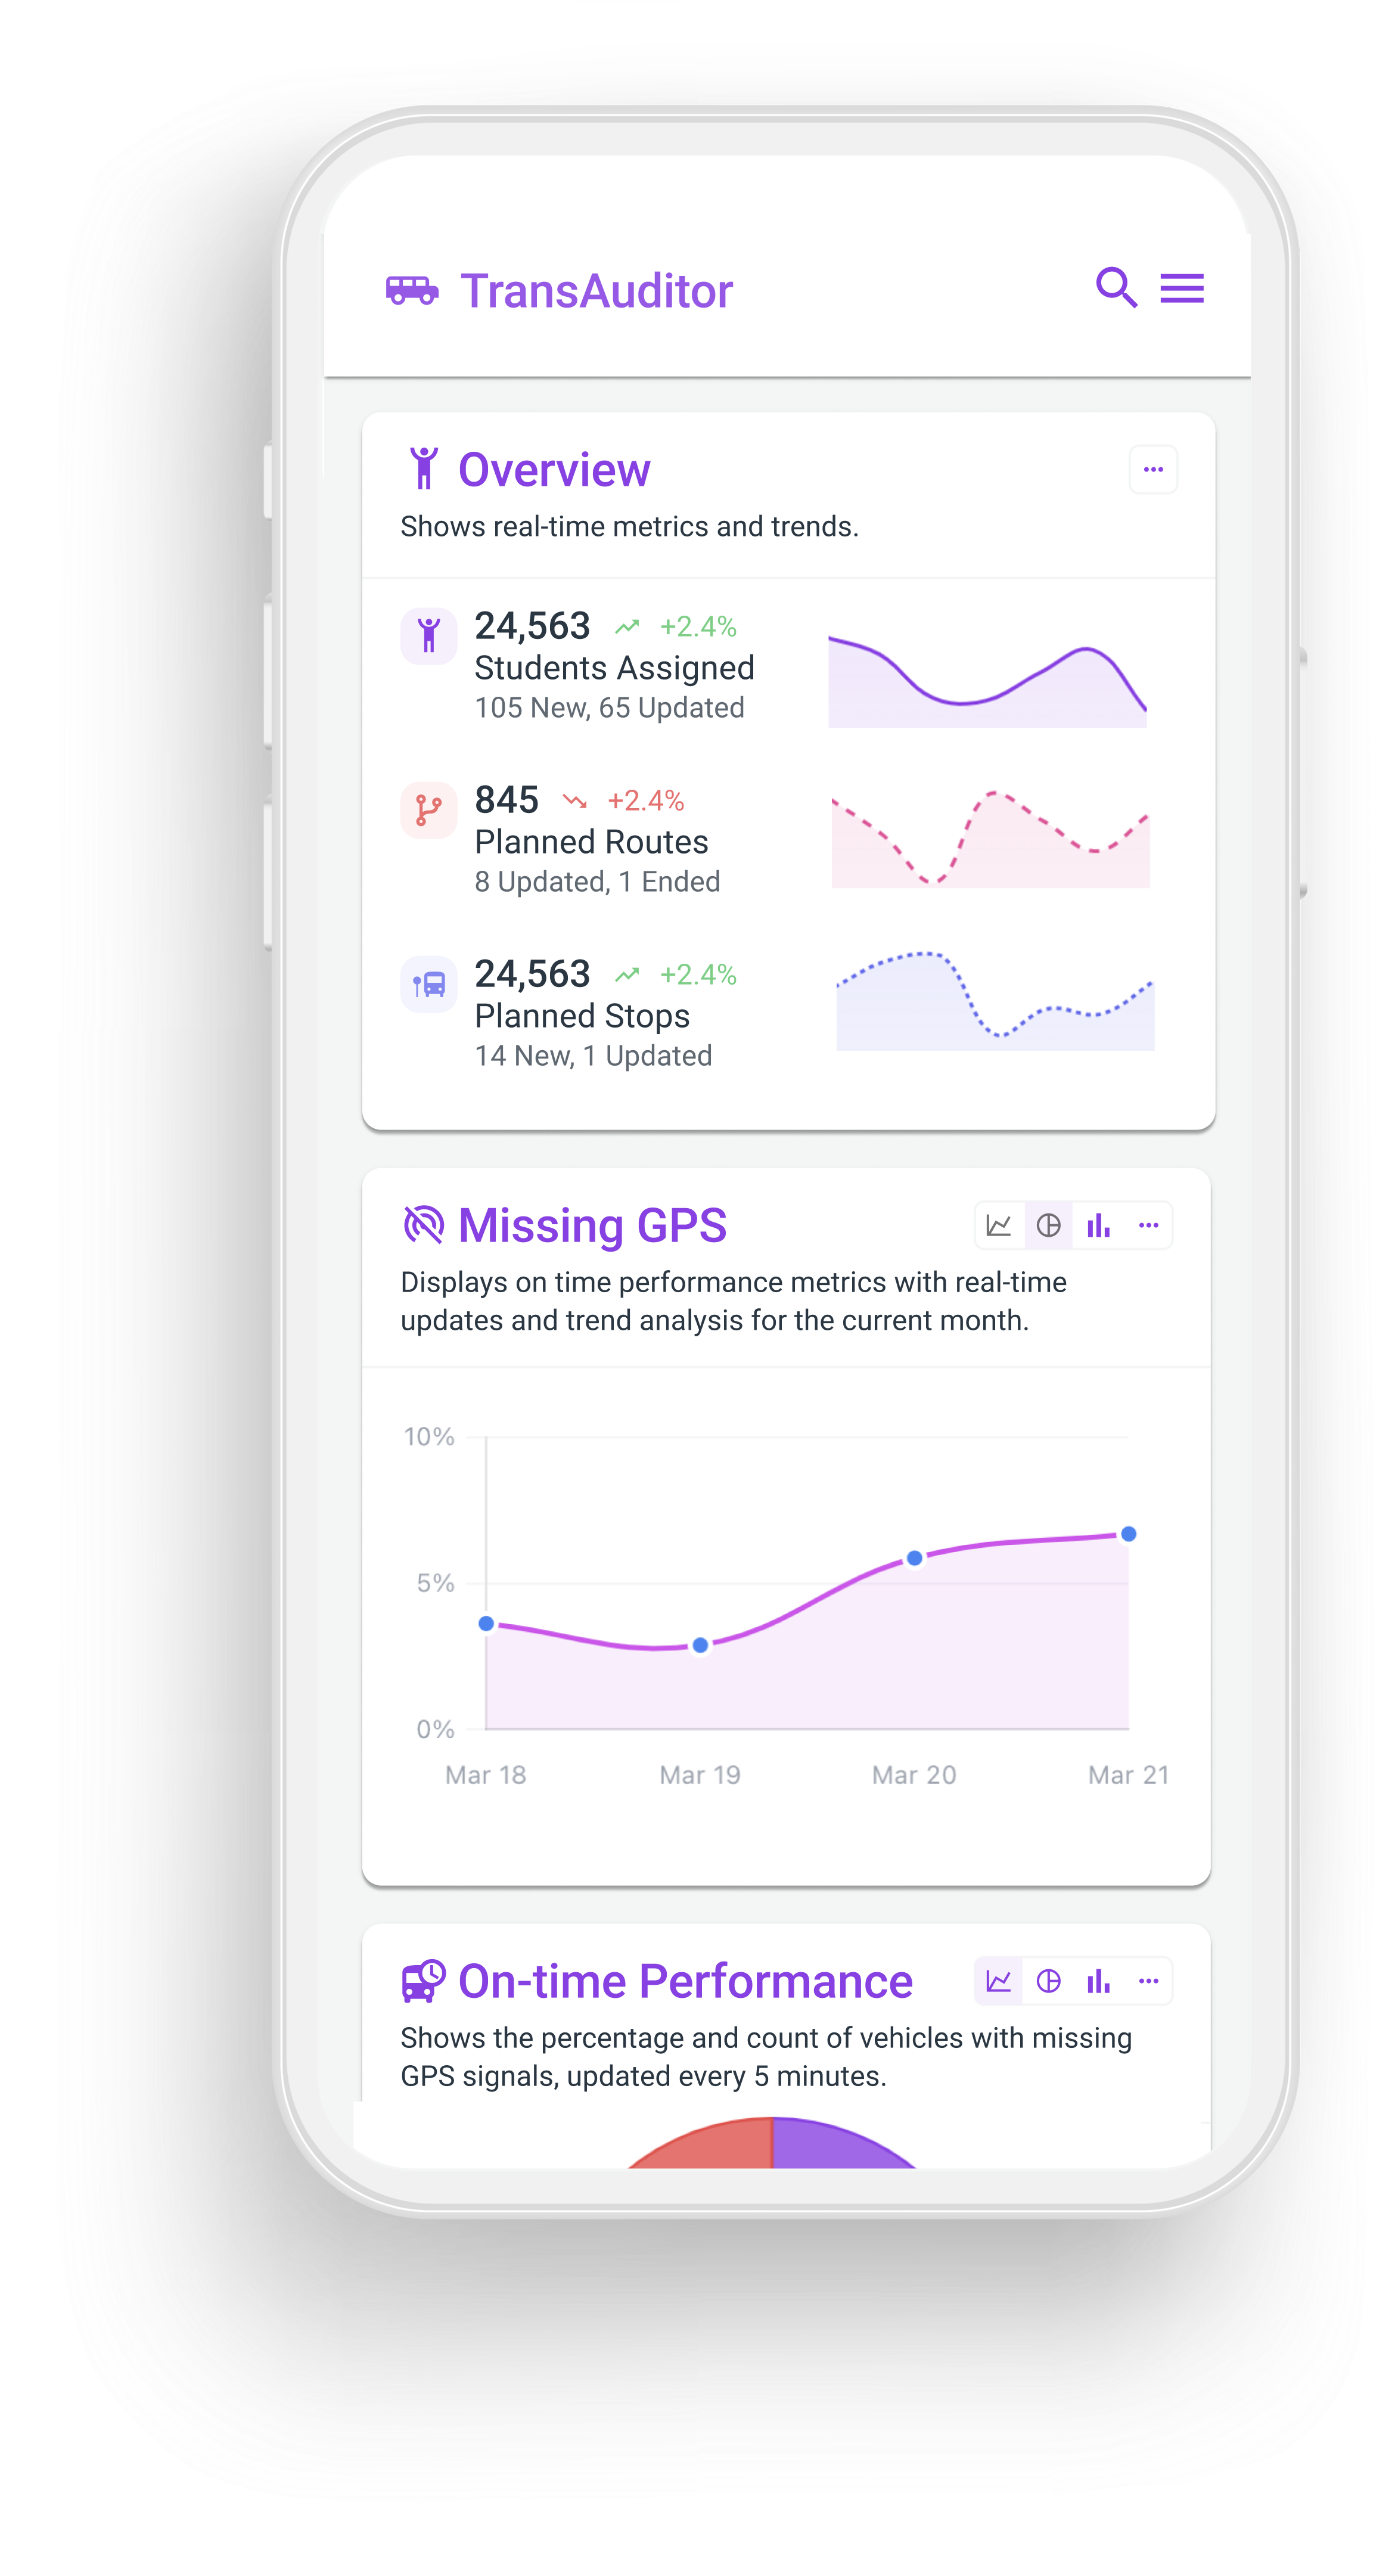
The team selected a component library, Vuetify, and Chart.js to generate visuals for our dashboards and displays. I customized the library’s themes and created additional components needed to execute a product of this complexity. I worked with our Front-end Developer to render charts in the clearest, most useful way for our users.


DASHBOARD DESIGN
Dashboard Design: I designed a dashboard configurable with a user’s most-referenced metrics. From data collected in our survey and interviews, we have a defined default KPI displays per user type that reflect the majority opinion of transportation employees. This is the main module used by the Transportation Director and Accounting Specialist.
TIERING ANALYSIS DESIGN
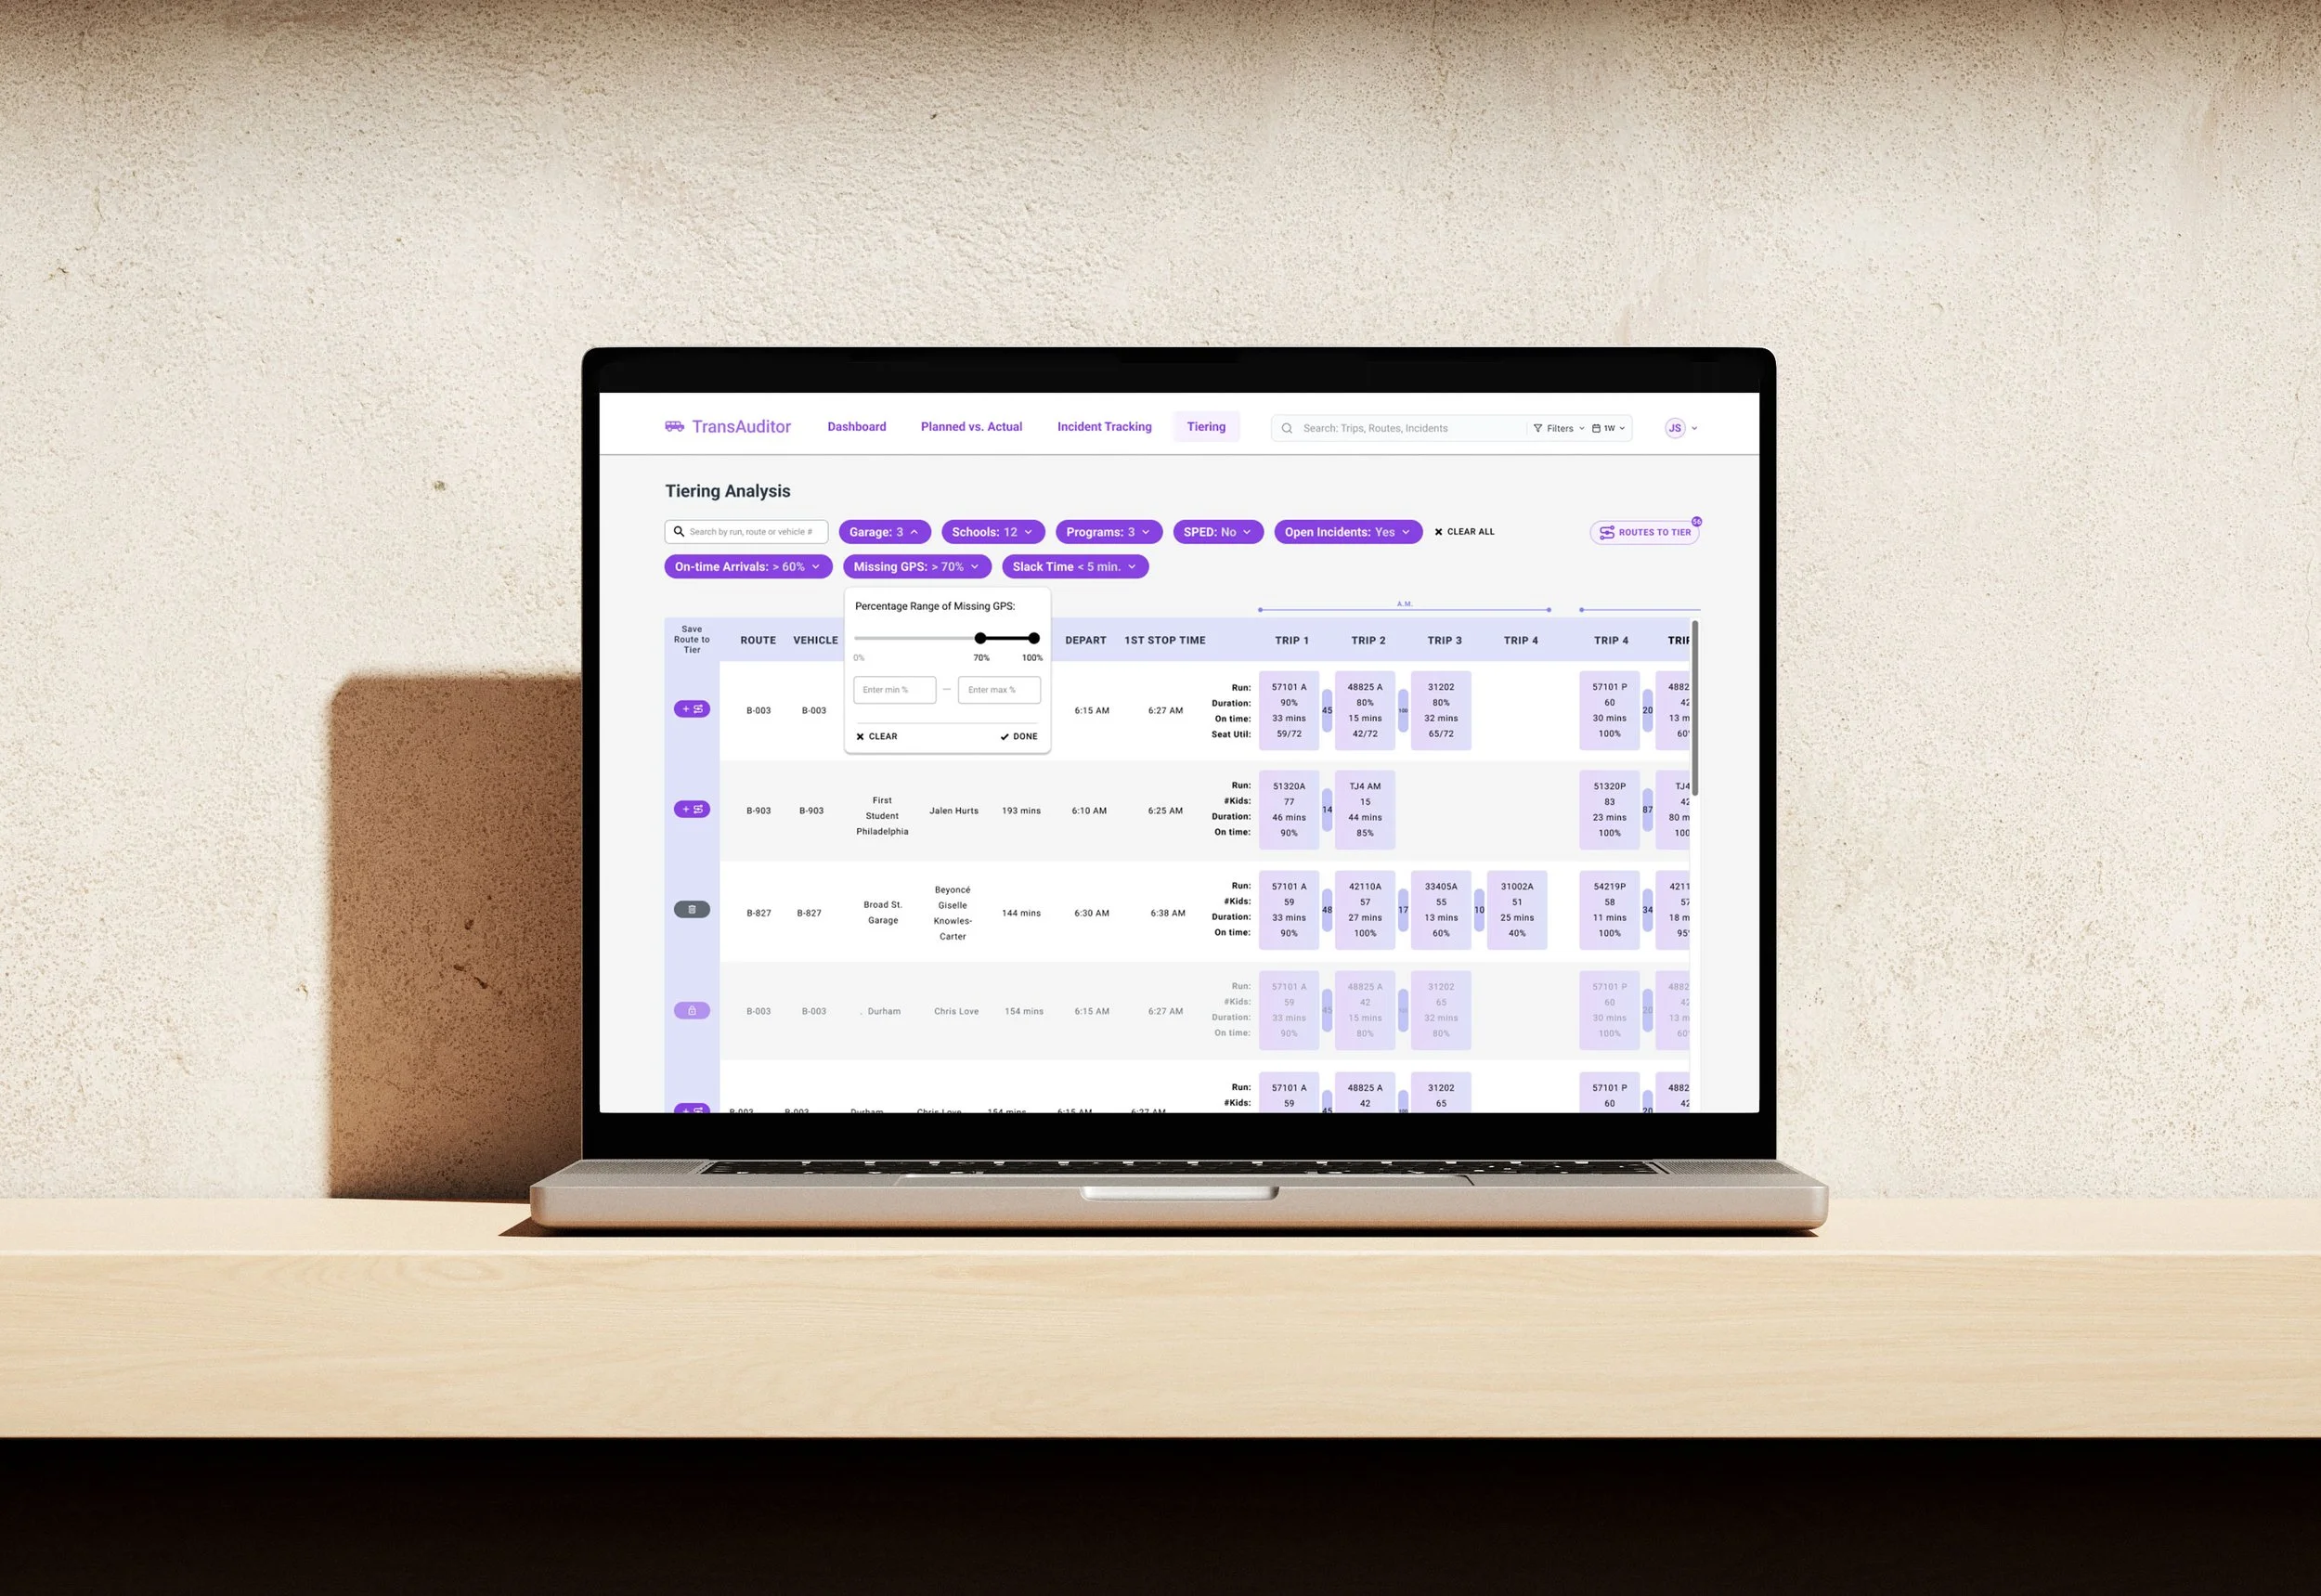
Tiering refers to organizing bus routes and schedules into different time “tiers” so that the same buses can be used for multiple runs in a single morning or afternoon. This tool—built for Routing Analysts—uses our team’s carefully configured algorithms to evaluate the efficacy of a district’s current tiering system. I designed an approach that displays routes (the planned path a bus follows to pick up or drop off students in the AM or PM; comprising 2–4 trips), trips (a single instance of operating within a route for one school at one time), and slack time (the downtime between trips) in an easy-to-digest way. Users can filter to choose which routes they want to evaluate and add them to a “cart” to be reconfigured later.
TIERING PROCESS DESIGN
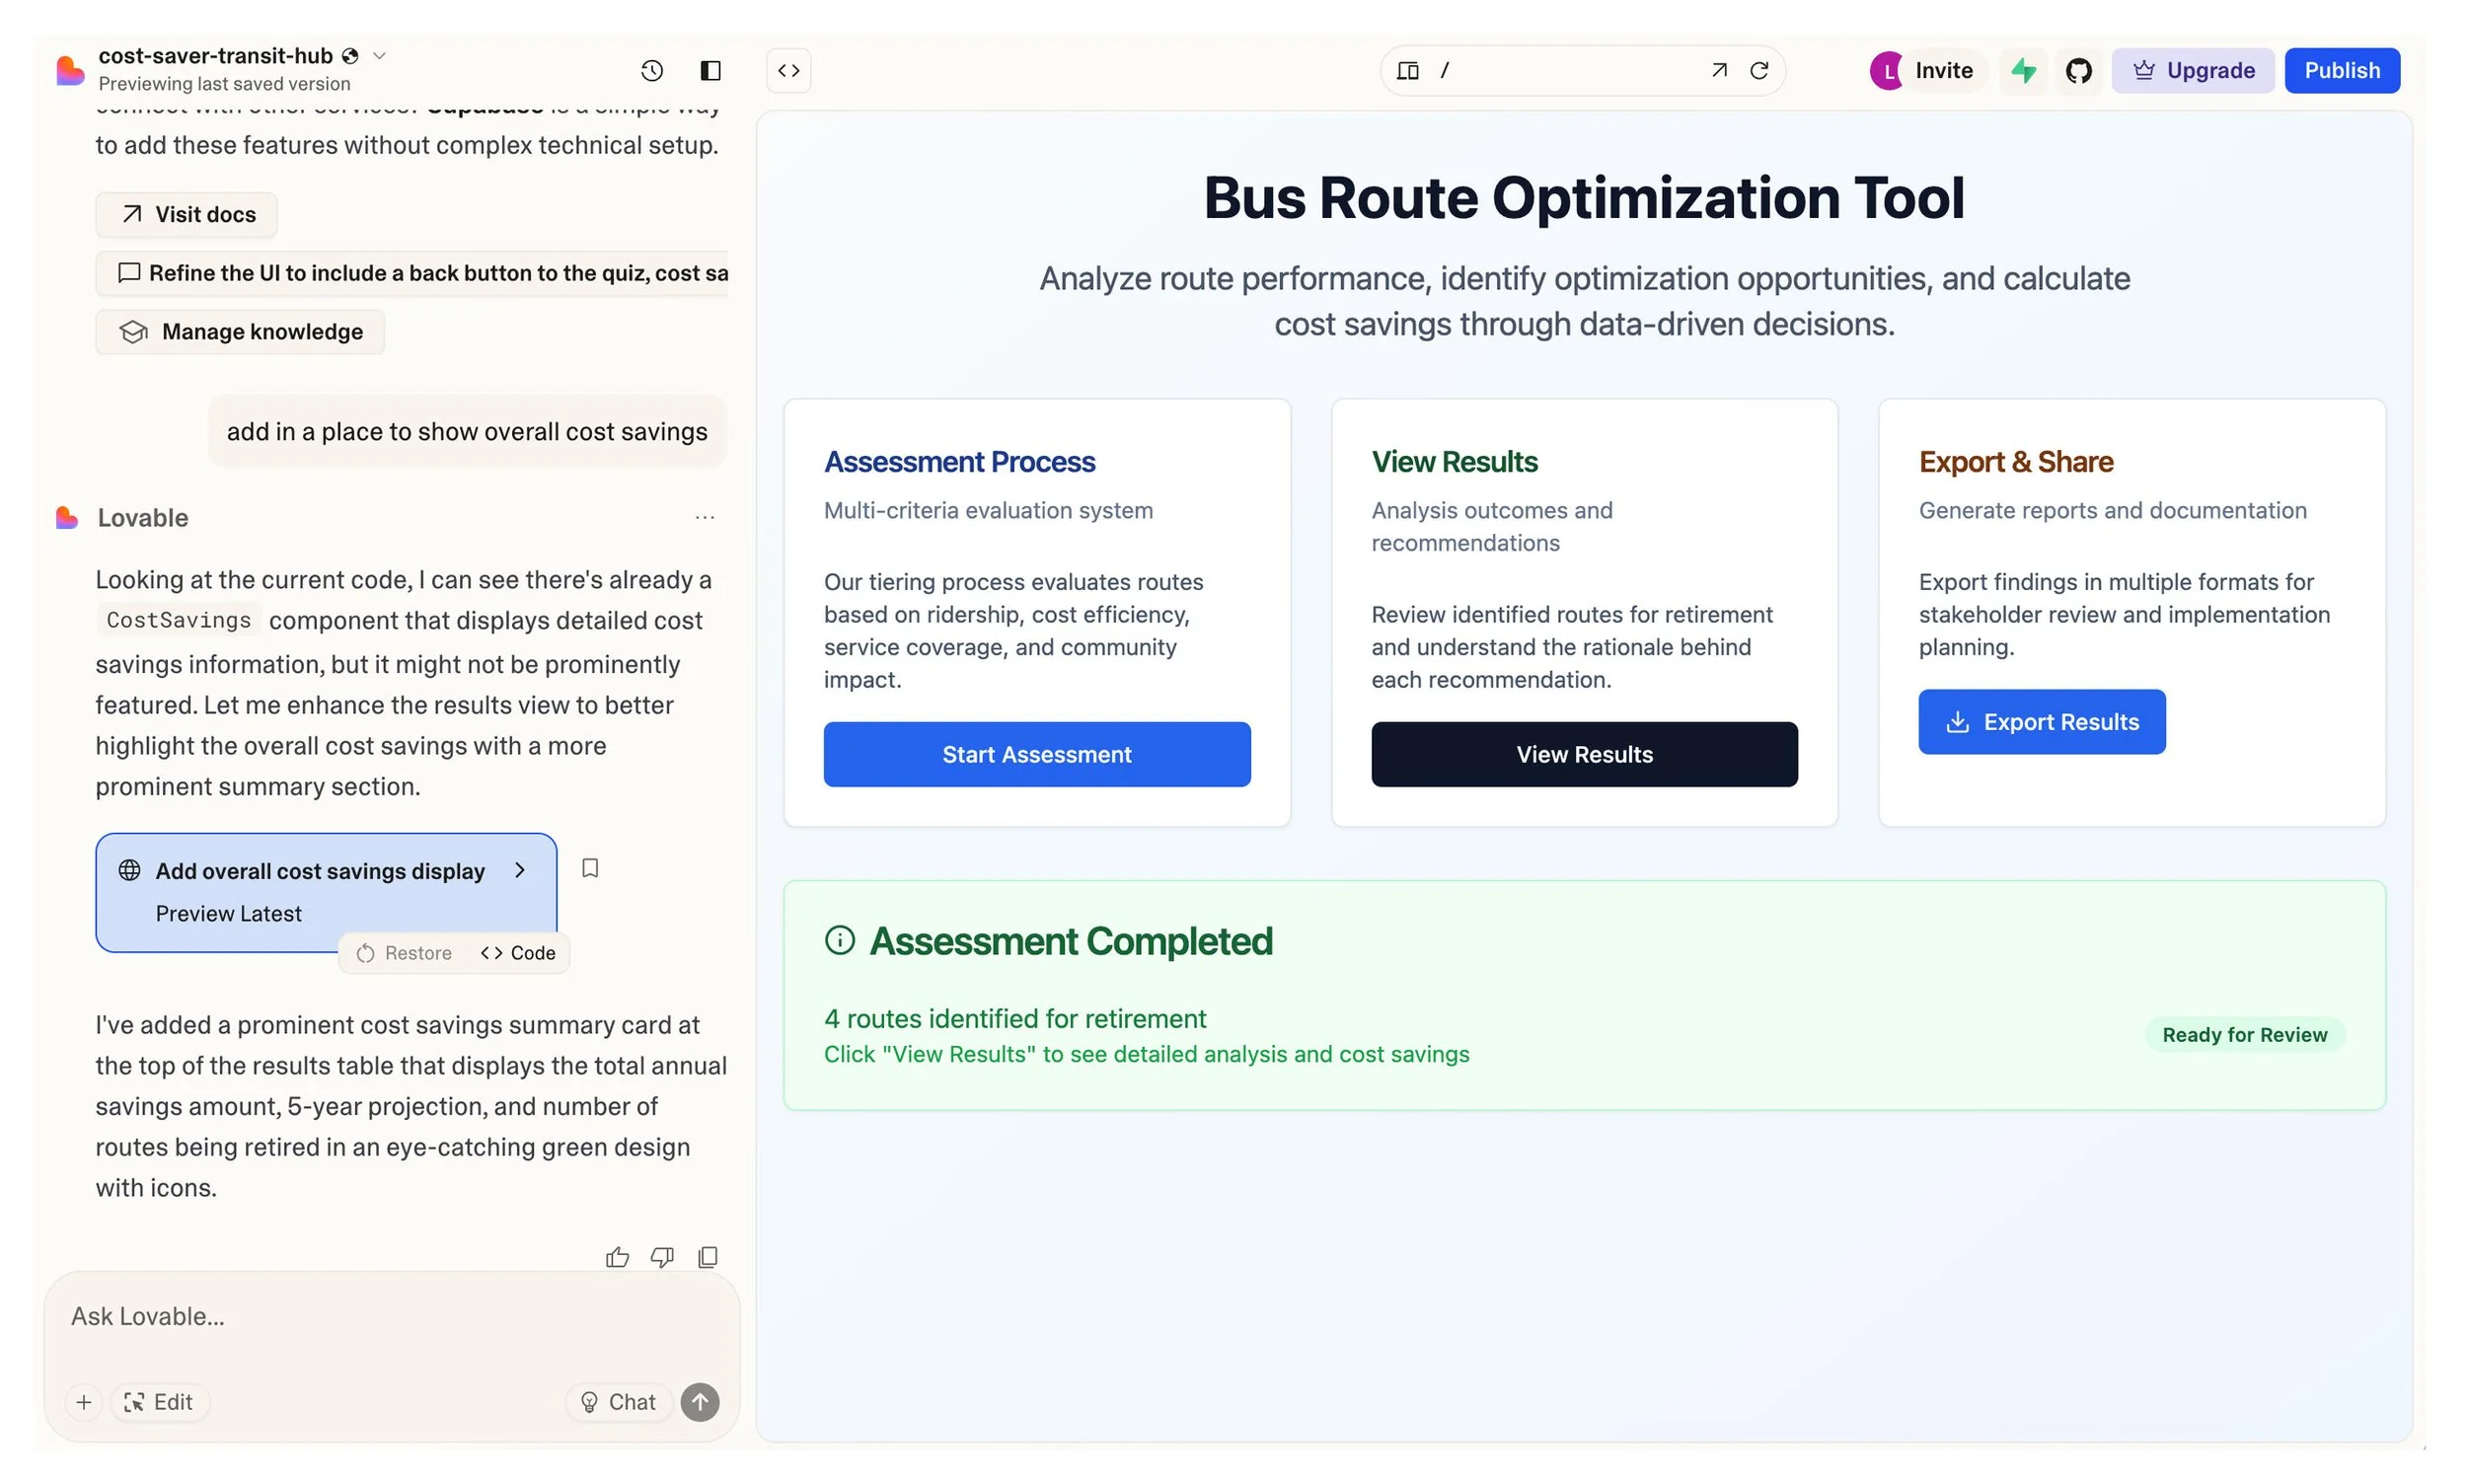
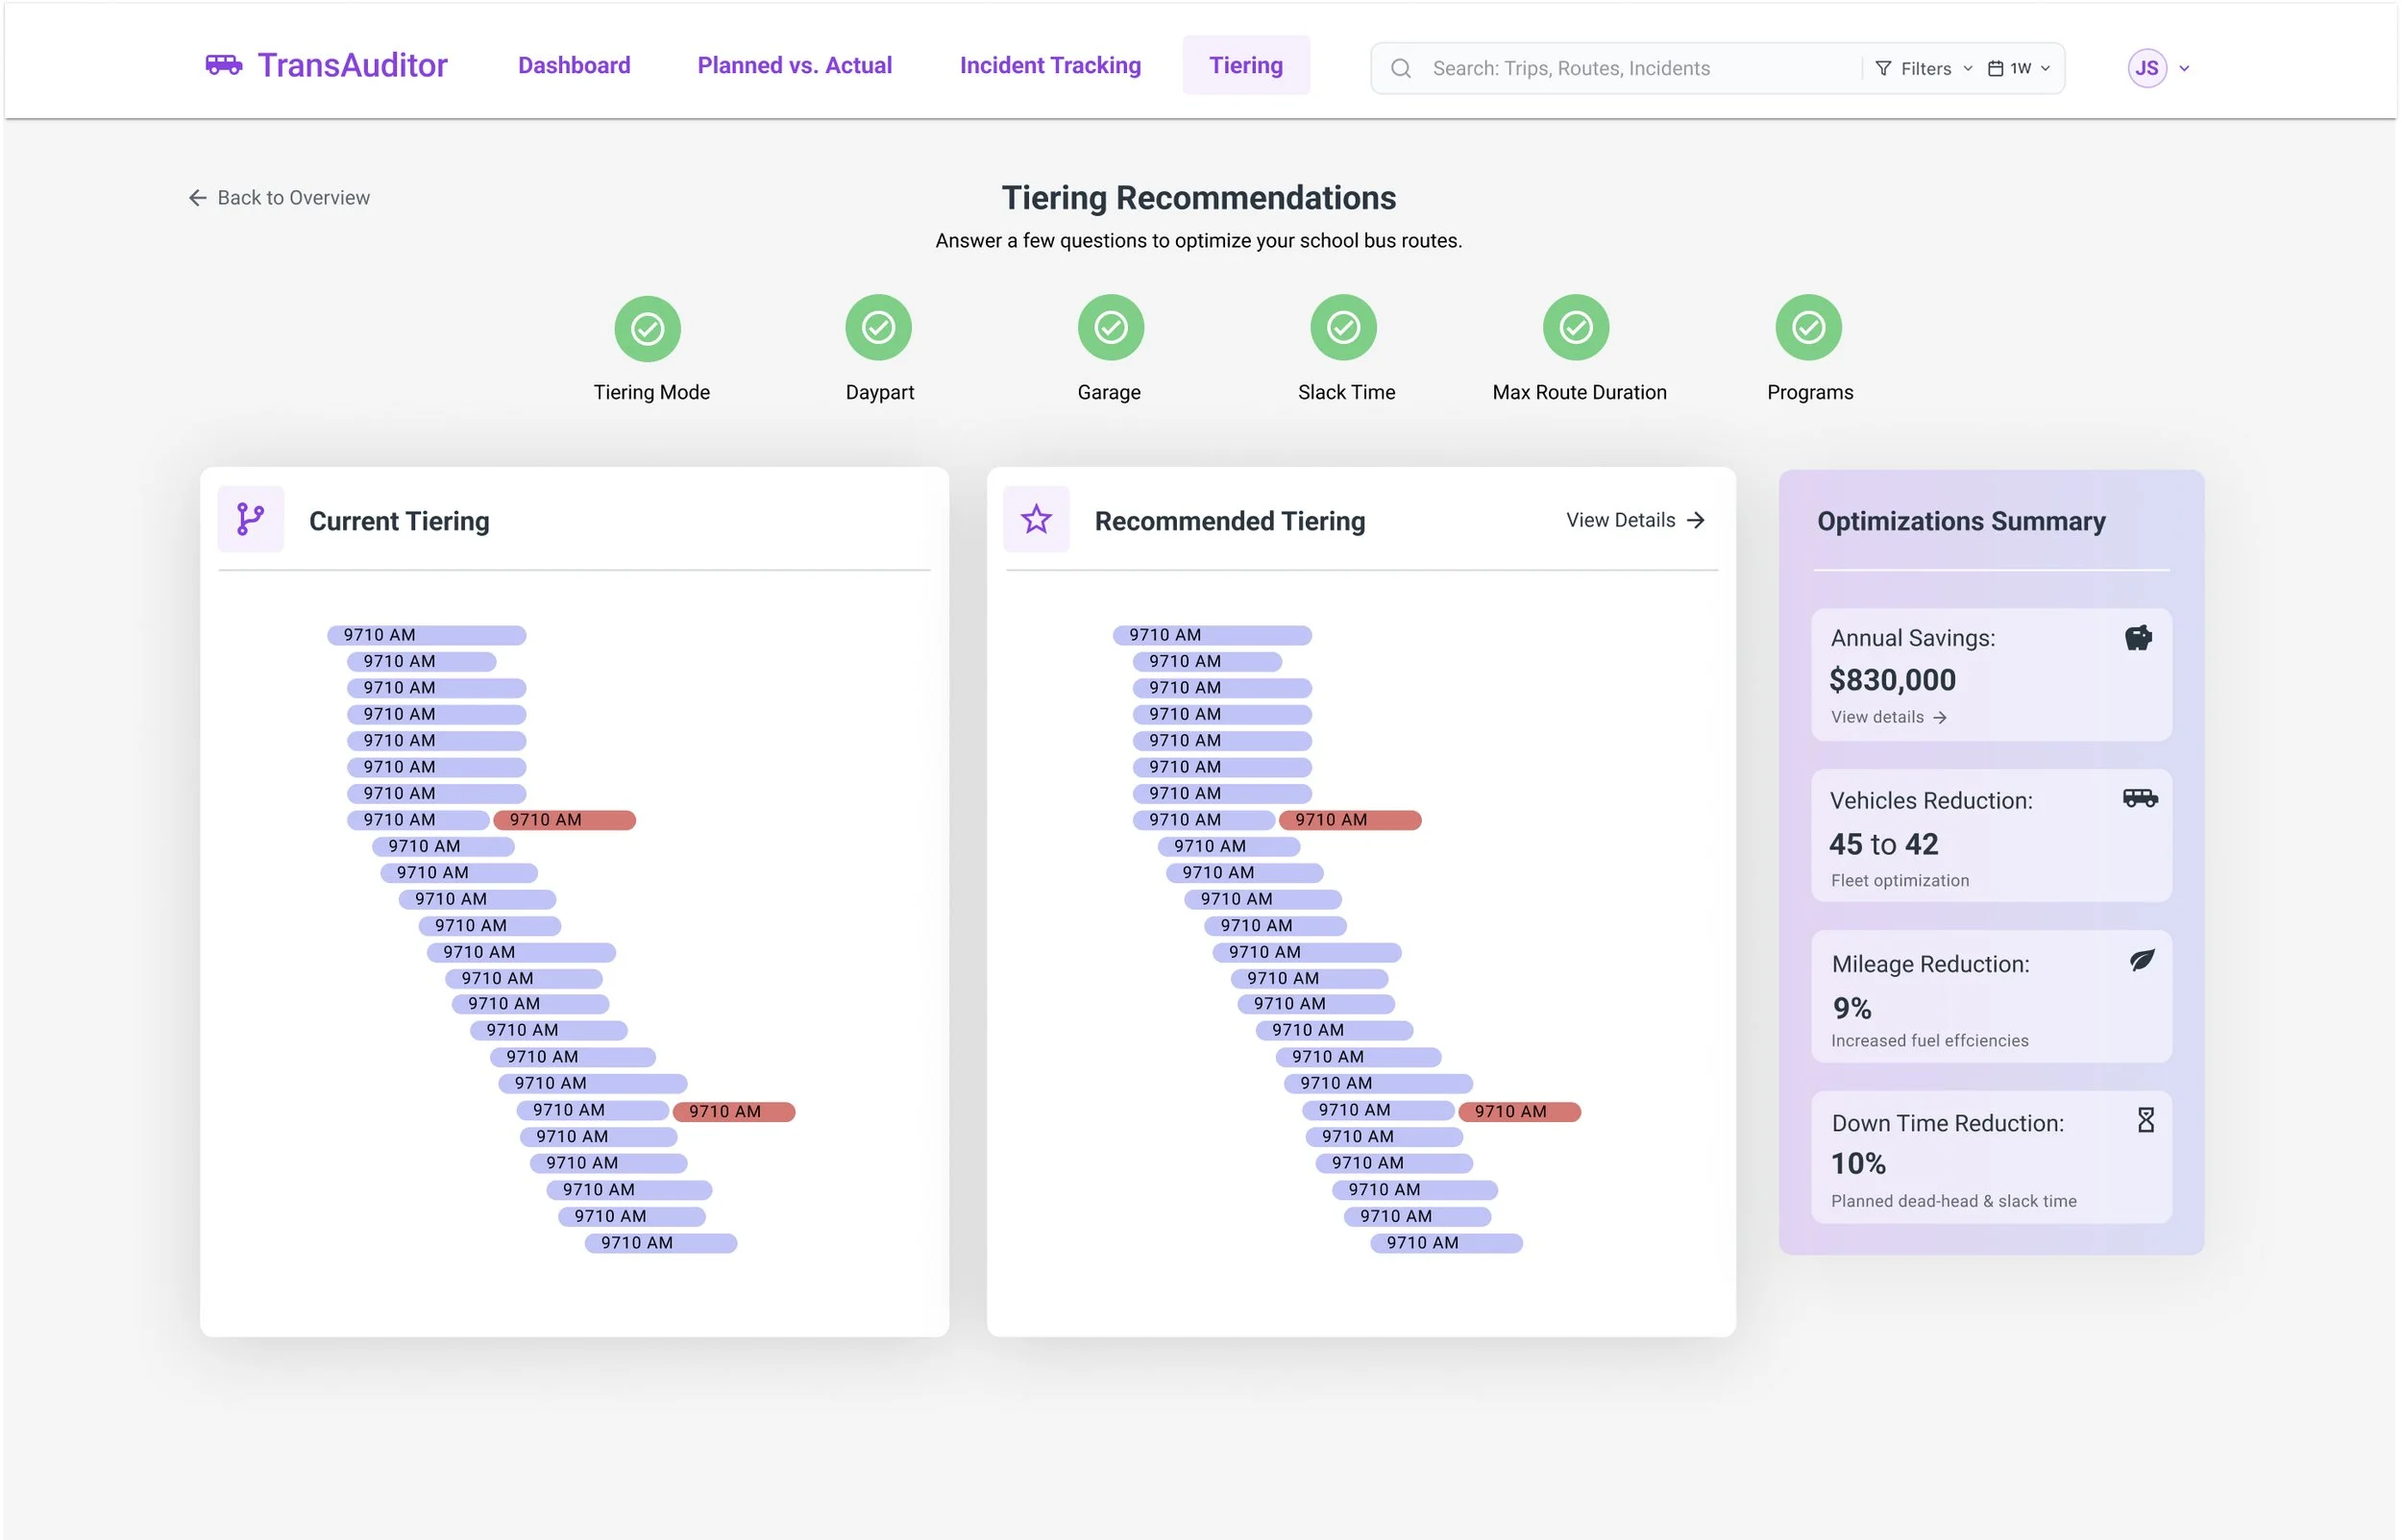
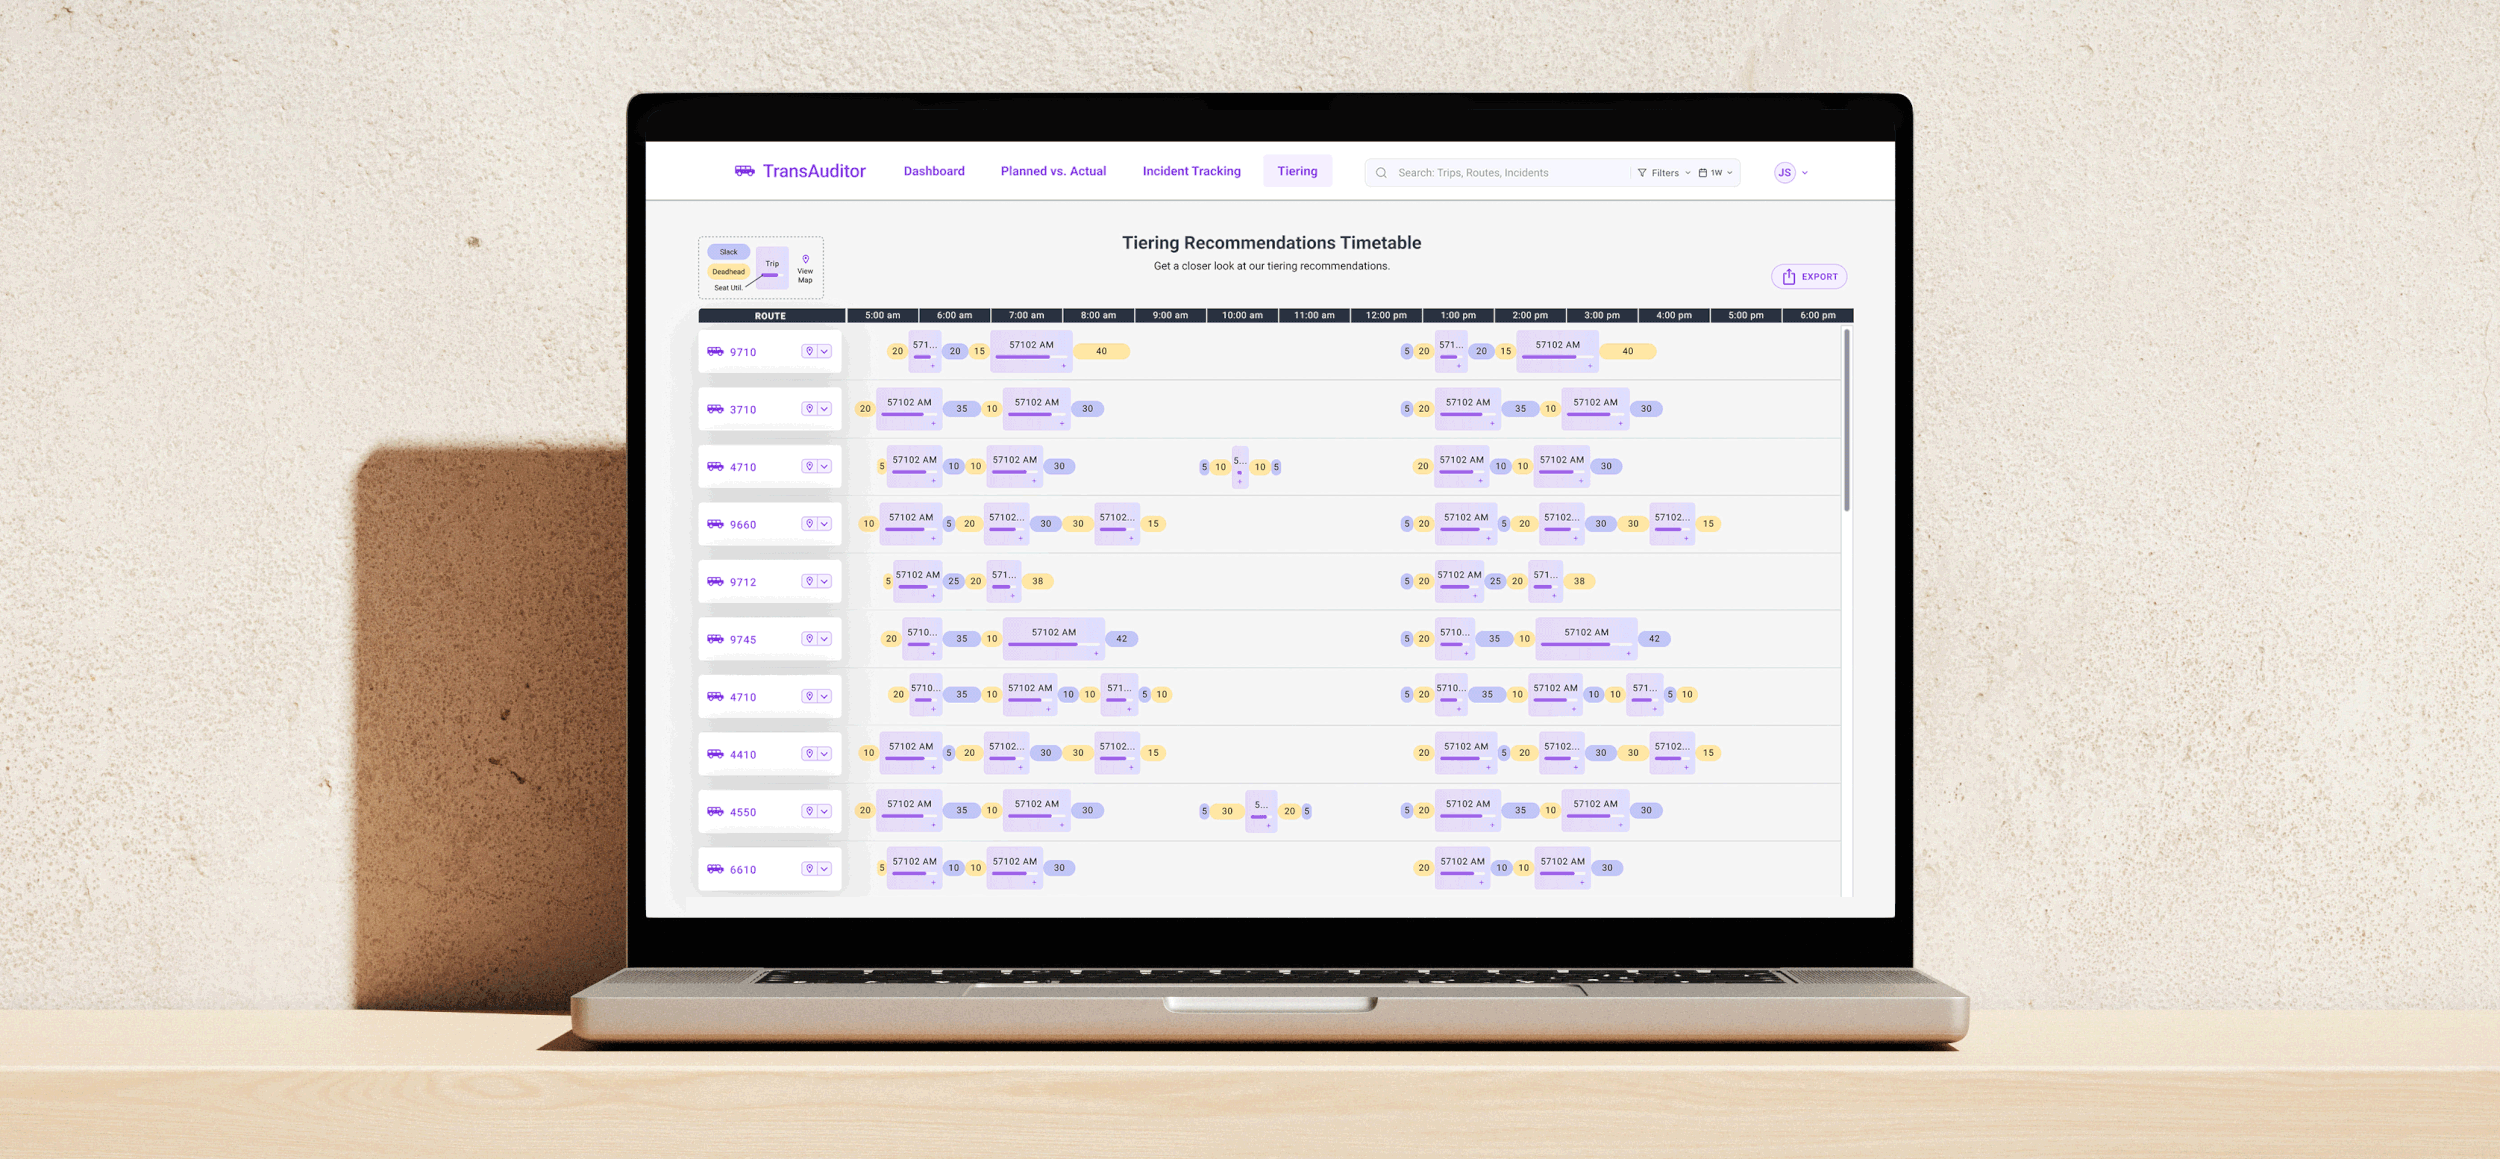
Continuing the Routing Analyst’s workflow, this tool takes routes that have been evaluated and marked inefficient, deeming them candidates for “re-tiering” (breaking up trips from existing routes and reorganizing them to reduce late arrivals, vehicles on the road, travel time for students, and overall costs). This module reduces six weeks of manual work to three or four days. I built a step-by-step process for users who want to re-tier existing routes. After completing the flow, users receive a high-level summary of potential economic and environmental optimizations. For more granular detail, they can view a detailed timetable with the newly suggested routes. This shows route information including SPED requirements as well as seat utilization (students ÷ vehicle capacity). Downtime is differentiated from driving time by shape and color. Users can open a dialog box with a GPS map of the route. After feedback from several potential clients, we heard a consistent request: "Please display a summary of cost savings.” So we updated the flow to include a financial savings view and itemized cost breakdown.


INIITAL RESPONSE
“I think this design solution for TransAuditor has the potential to change the industry.”
-Nan D., Chief Product Officer, Geo Data Intelligence
“I can’t express how happy I am with your approach. You asked insightful questions, leveraged our research to make decisions, and designed a new product that is easy to use. Without having any previous experience in the transportation industry, you simplified complex information, smoothed the experience, and created something beautiful.”
-Chris L., Product Manager, Geo Data Intelligence
“This tool is going to be so helpful for districts large and small, and I love that you can configure it to meet each transportation department’s needs. I can see so many future use cases for this tool beyond the initial ones outlined. If this design experience stunk; don’t worry, I would tell you!”
-Jim B., School Transportation Consultant
Product Feedback: Geo Data Intelligence’s account managers have relationships with some of the largest school districts in the country. They are teasing some of the modules to existing clients like the Las Vegas, Houston, Philadelphia, and D.C. school districts to get their initial feedback. So, far those districts have shared their enthusiasm for the product’s potential to make their team’s workflow more accurate and efficient, saving weeks of time and possibly millions of dollars for the district. This project is still in progress.